If you were to go and do a simple internet search for the phrase “artistic representations of Pi” (and I encourage you do so), you’d find a slew of amazing looking pieces that generally depict what looks like random noise. Sure, the noise may be presented elegantly, but the fact still remains, the digits of Pi, when plotted out, just represent an overall lack of pattern.
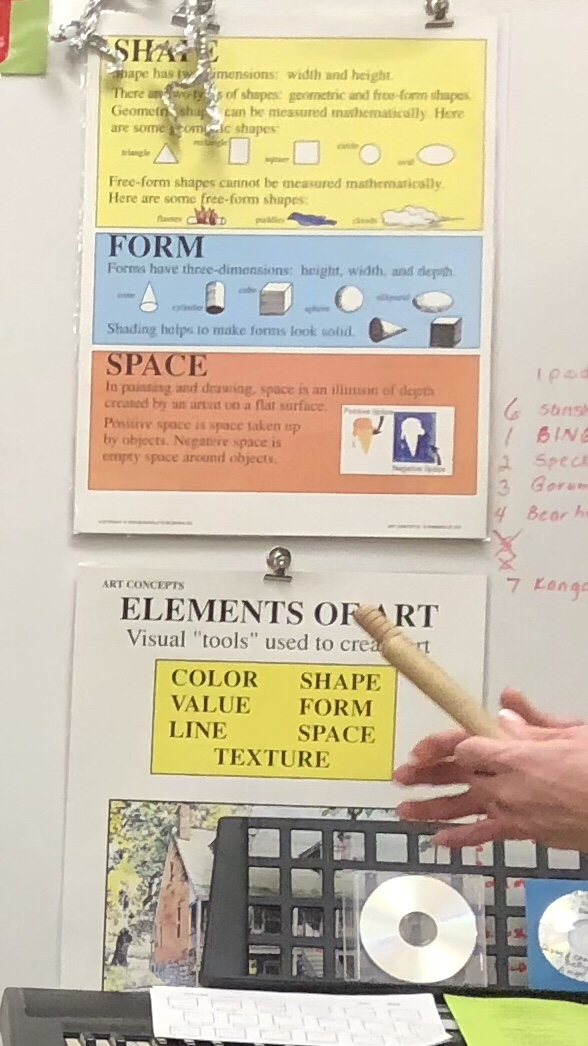
You see, people tend to focus on the actual digits. Before I begin talking about an alternative approach, let’s talk about art in general. Upon the wall of my son’s pre-school classroom is a chart which reads: ELEMENTS OF ART. The elements include: Color, Value, Line, Texture, Shape, Form, and Space. This is a nice list that indicates the sort of elements that I tried to bring to the problem of representing Pi in what I believe are three very interesting ways.
There are a couple of other mathematical concepts that relate to art which I relied on heavily for this project. The first is Symmetry. By imposing symmetry onto Pi, it becomes less about the noise. This I did by folding Pi into a circle. Quite apropos, but it’s been done before.
The second thing was by studying which numbers do produce wonderful patterns in art. It turns out that this is done by creating what is called a Sequence. Arguably, the most famous sequence is the Fibonacci Sequence. This is created by using the real numbers and adding them together serially:
1, 1, 2, 3, 5, 8, 13 . . .
The Fibonacci Sequence is a marvel of the mathematical world as well as appears throughout the natural world in countless permutations.
Another famous sequence is the Primes. A number that can’t be divided by any number except itself and 1:
2,3,5,7, 11, 13, 17, 19 . . .
There is an entire library of sequences:
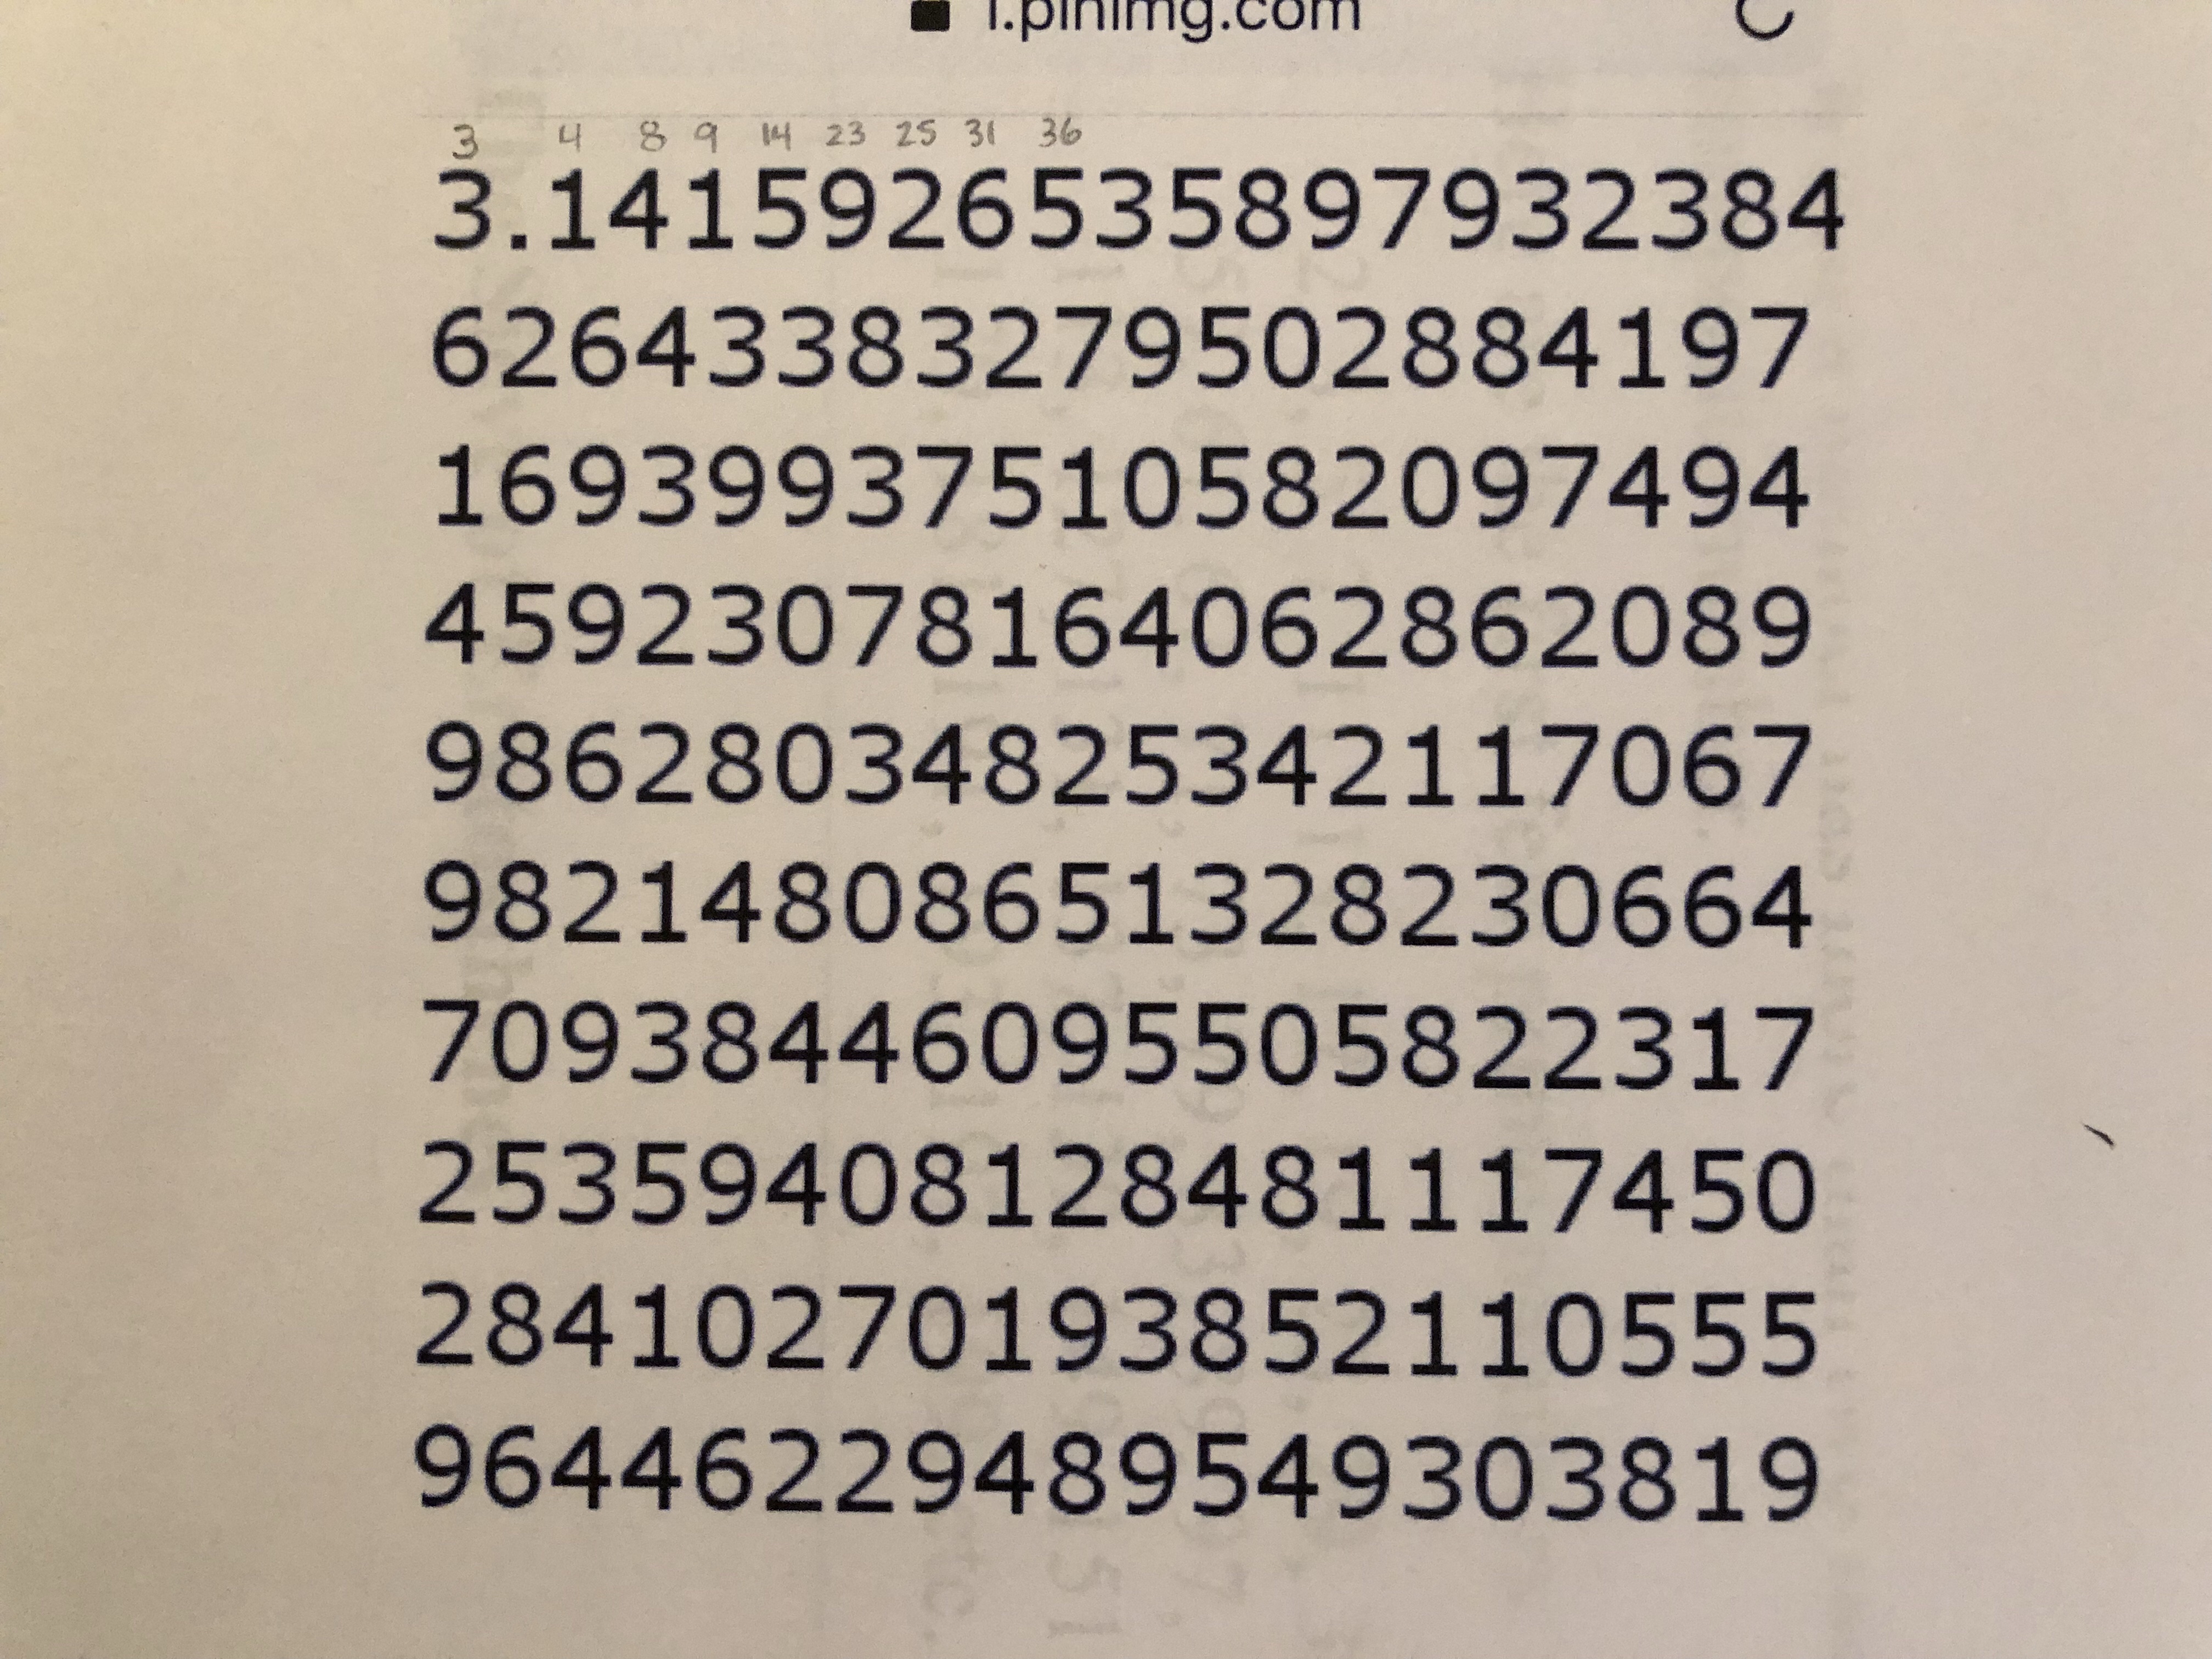
What is missing is the sequence created by adding the digits of Pi serially. I’ve searched and searched for the sequence’s name and for any research into exploring its properties, but, apparently, I’m laying claim to it.
The sequence turns out to be:
3, 4, 8, 9, 14, 23, 25, 31, 36 . . .
One thing you’ll notice about such sequences is that they almost always grow as the sequence progresses. It is because of the relationship between the numbers, rather than just the numbers themselves, that make sequences a great tool for an artist and a mathematician to explore.
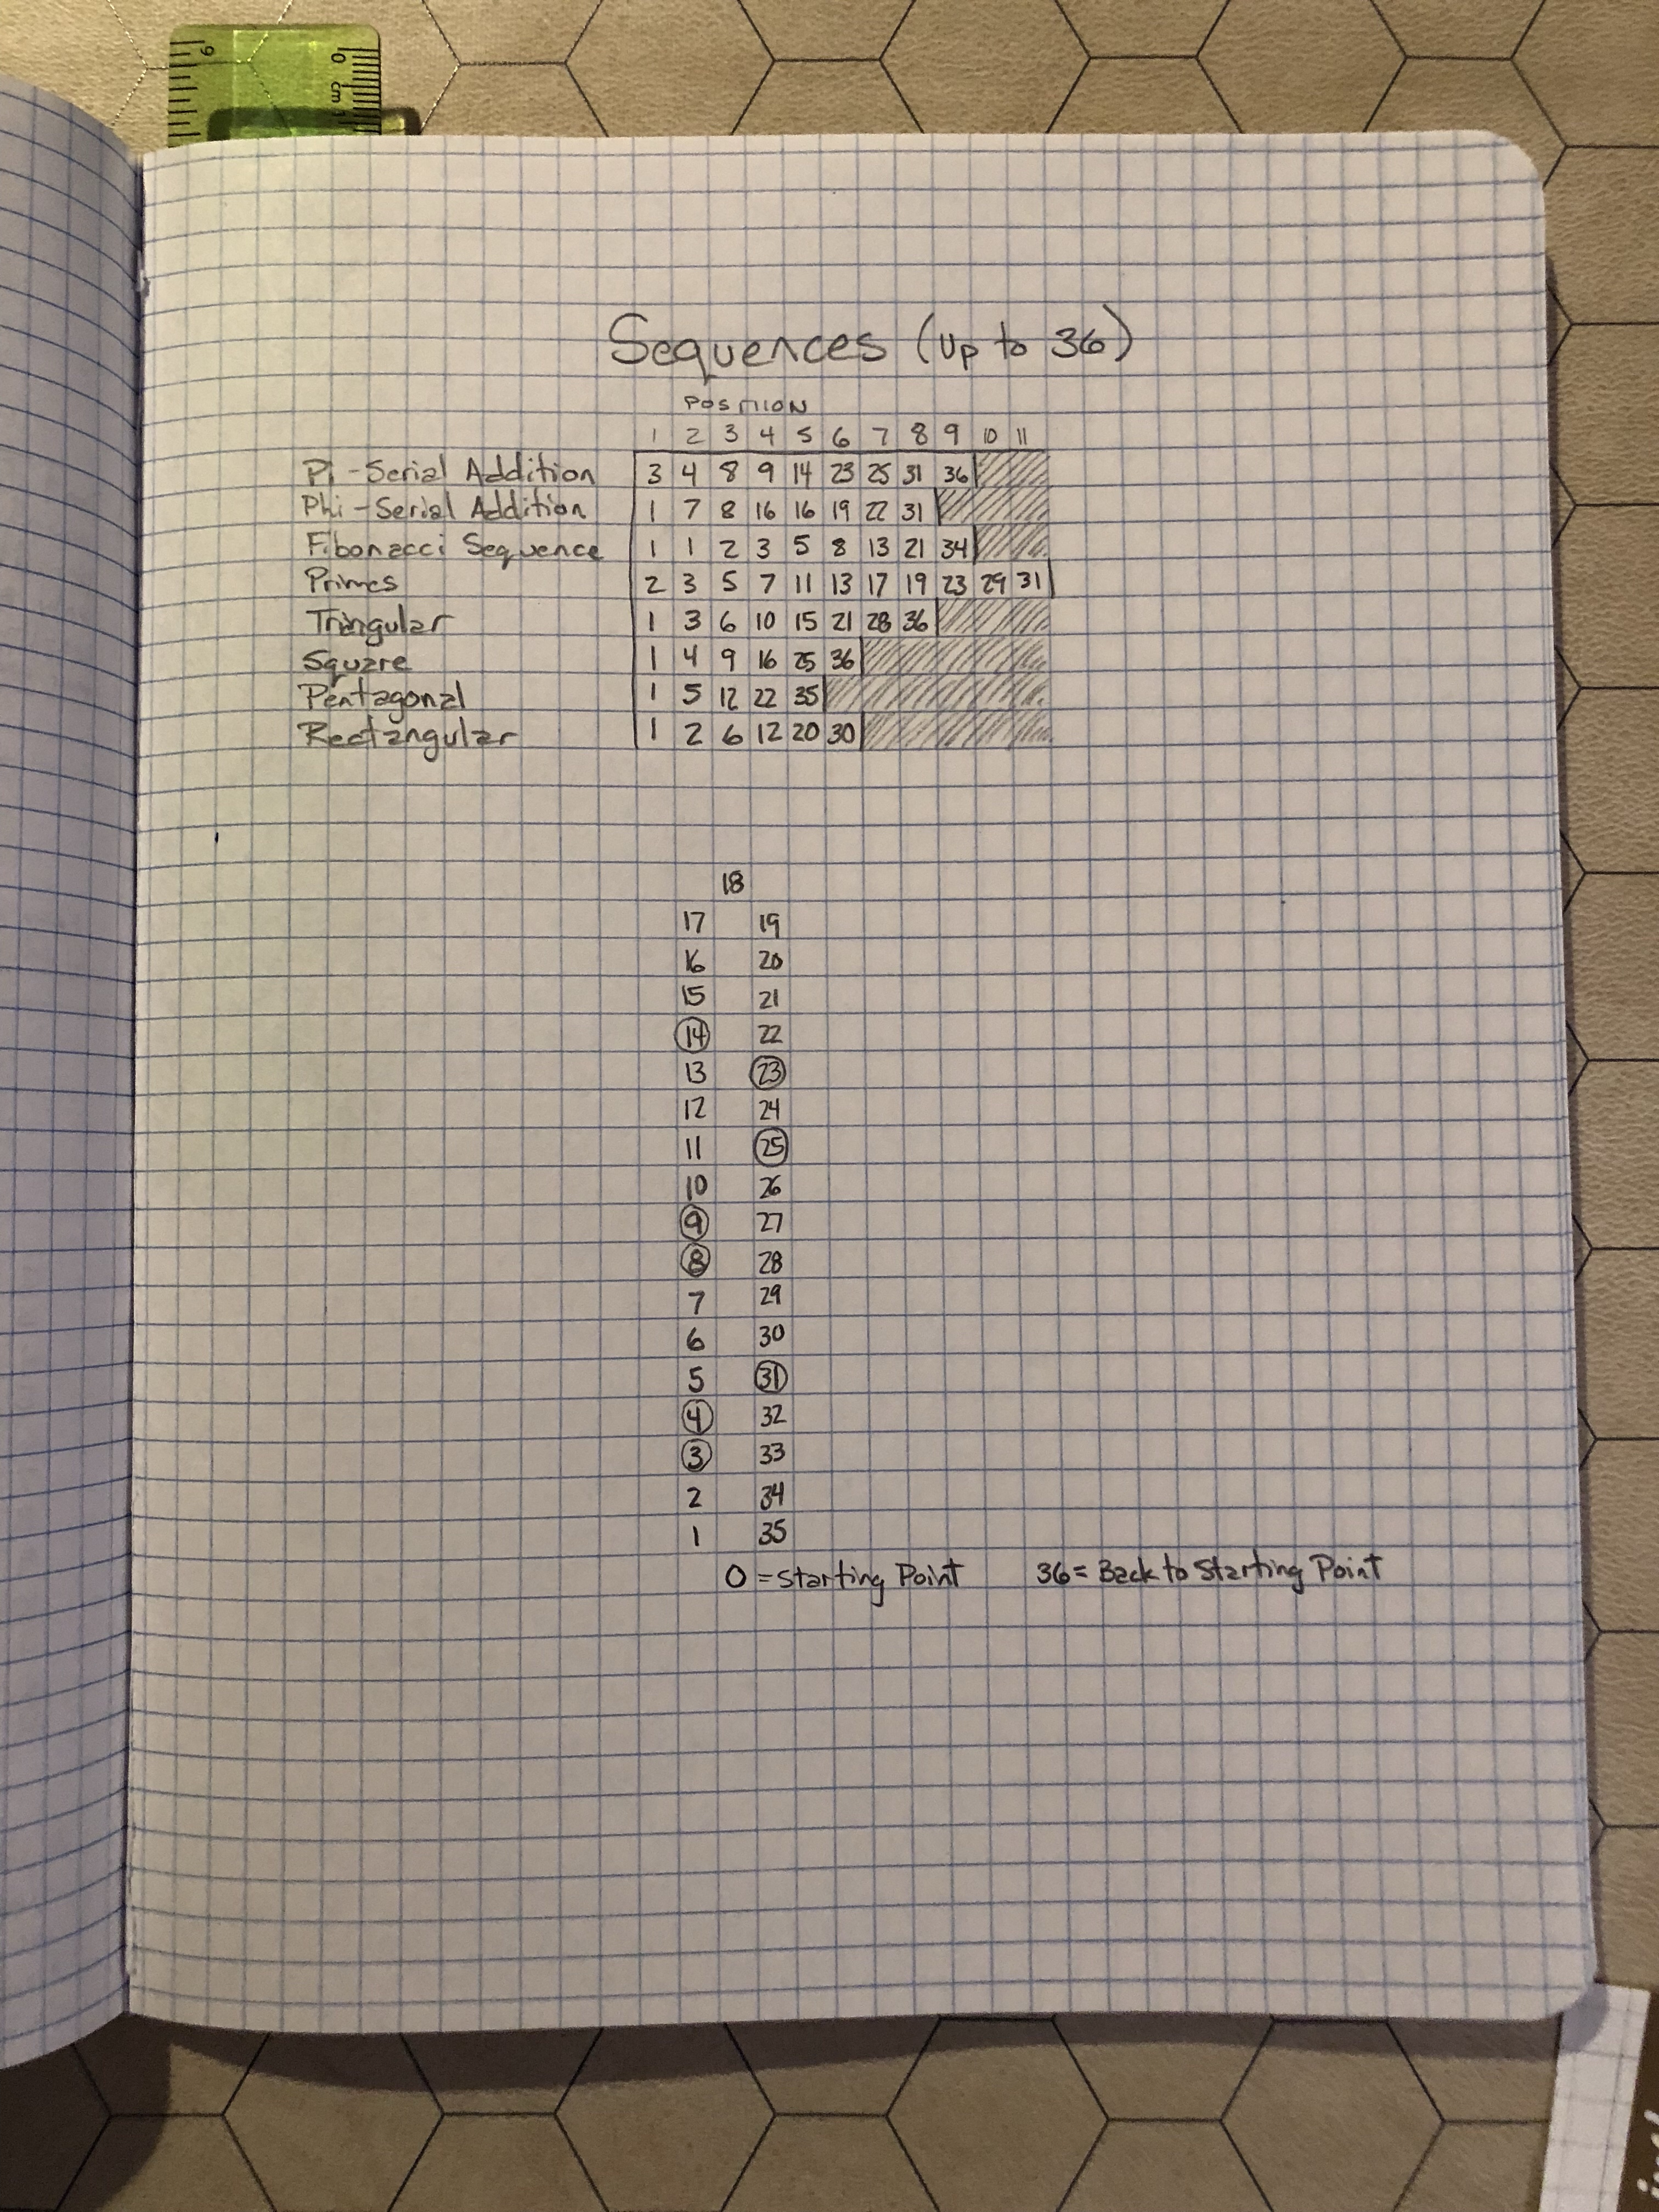
It should also be noted that I chose a 36 degree circle because of its divisibility and the fact that it limits most of the sequences I wanted to explore to a range of 6 to 11 numbers. A very manageable set that can be used for multiple purposes, as you’ll see. So, with the limit set to 36, the serialized Pi sequence we are going to explore by encoding into three schemas is once again:
3, 4, 8, 9, 14, 23, 25, 31, 36
These nine numbers will be turned into 3D Shapes, Colors, and Sounds.
To understand my approach, it helps to understand how to form a cardioid – a shape within a circle that resembles a heart.
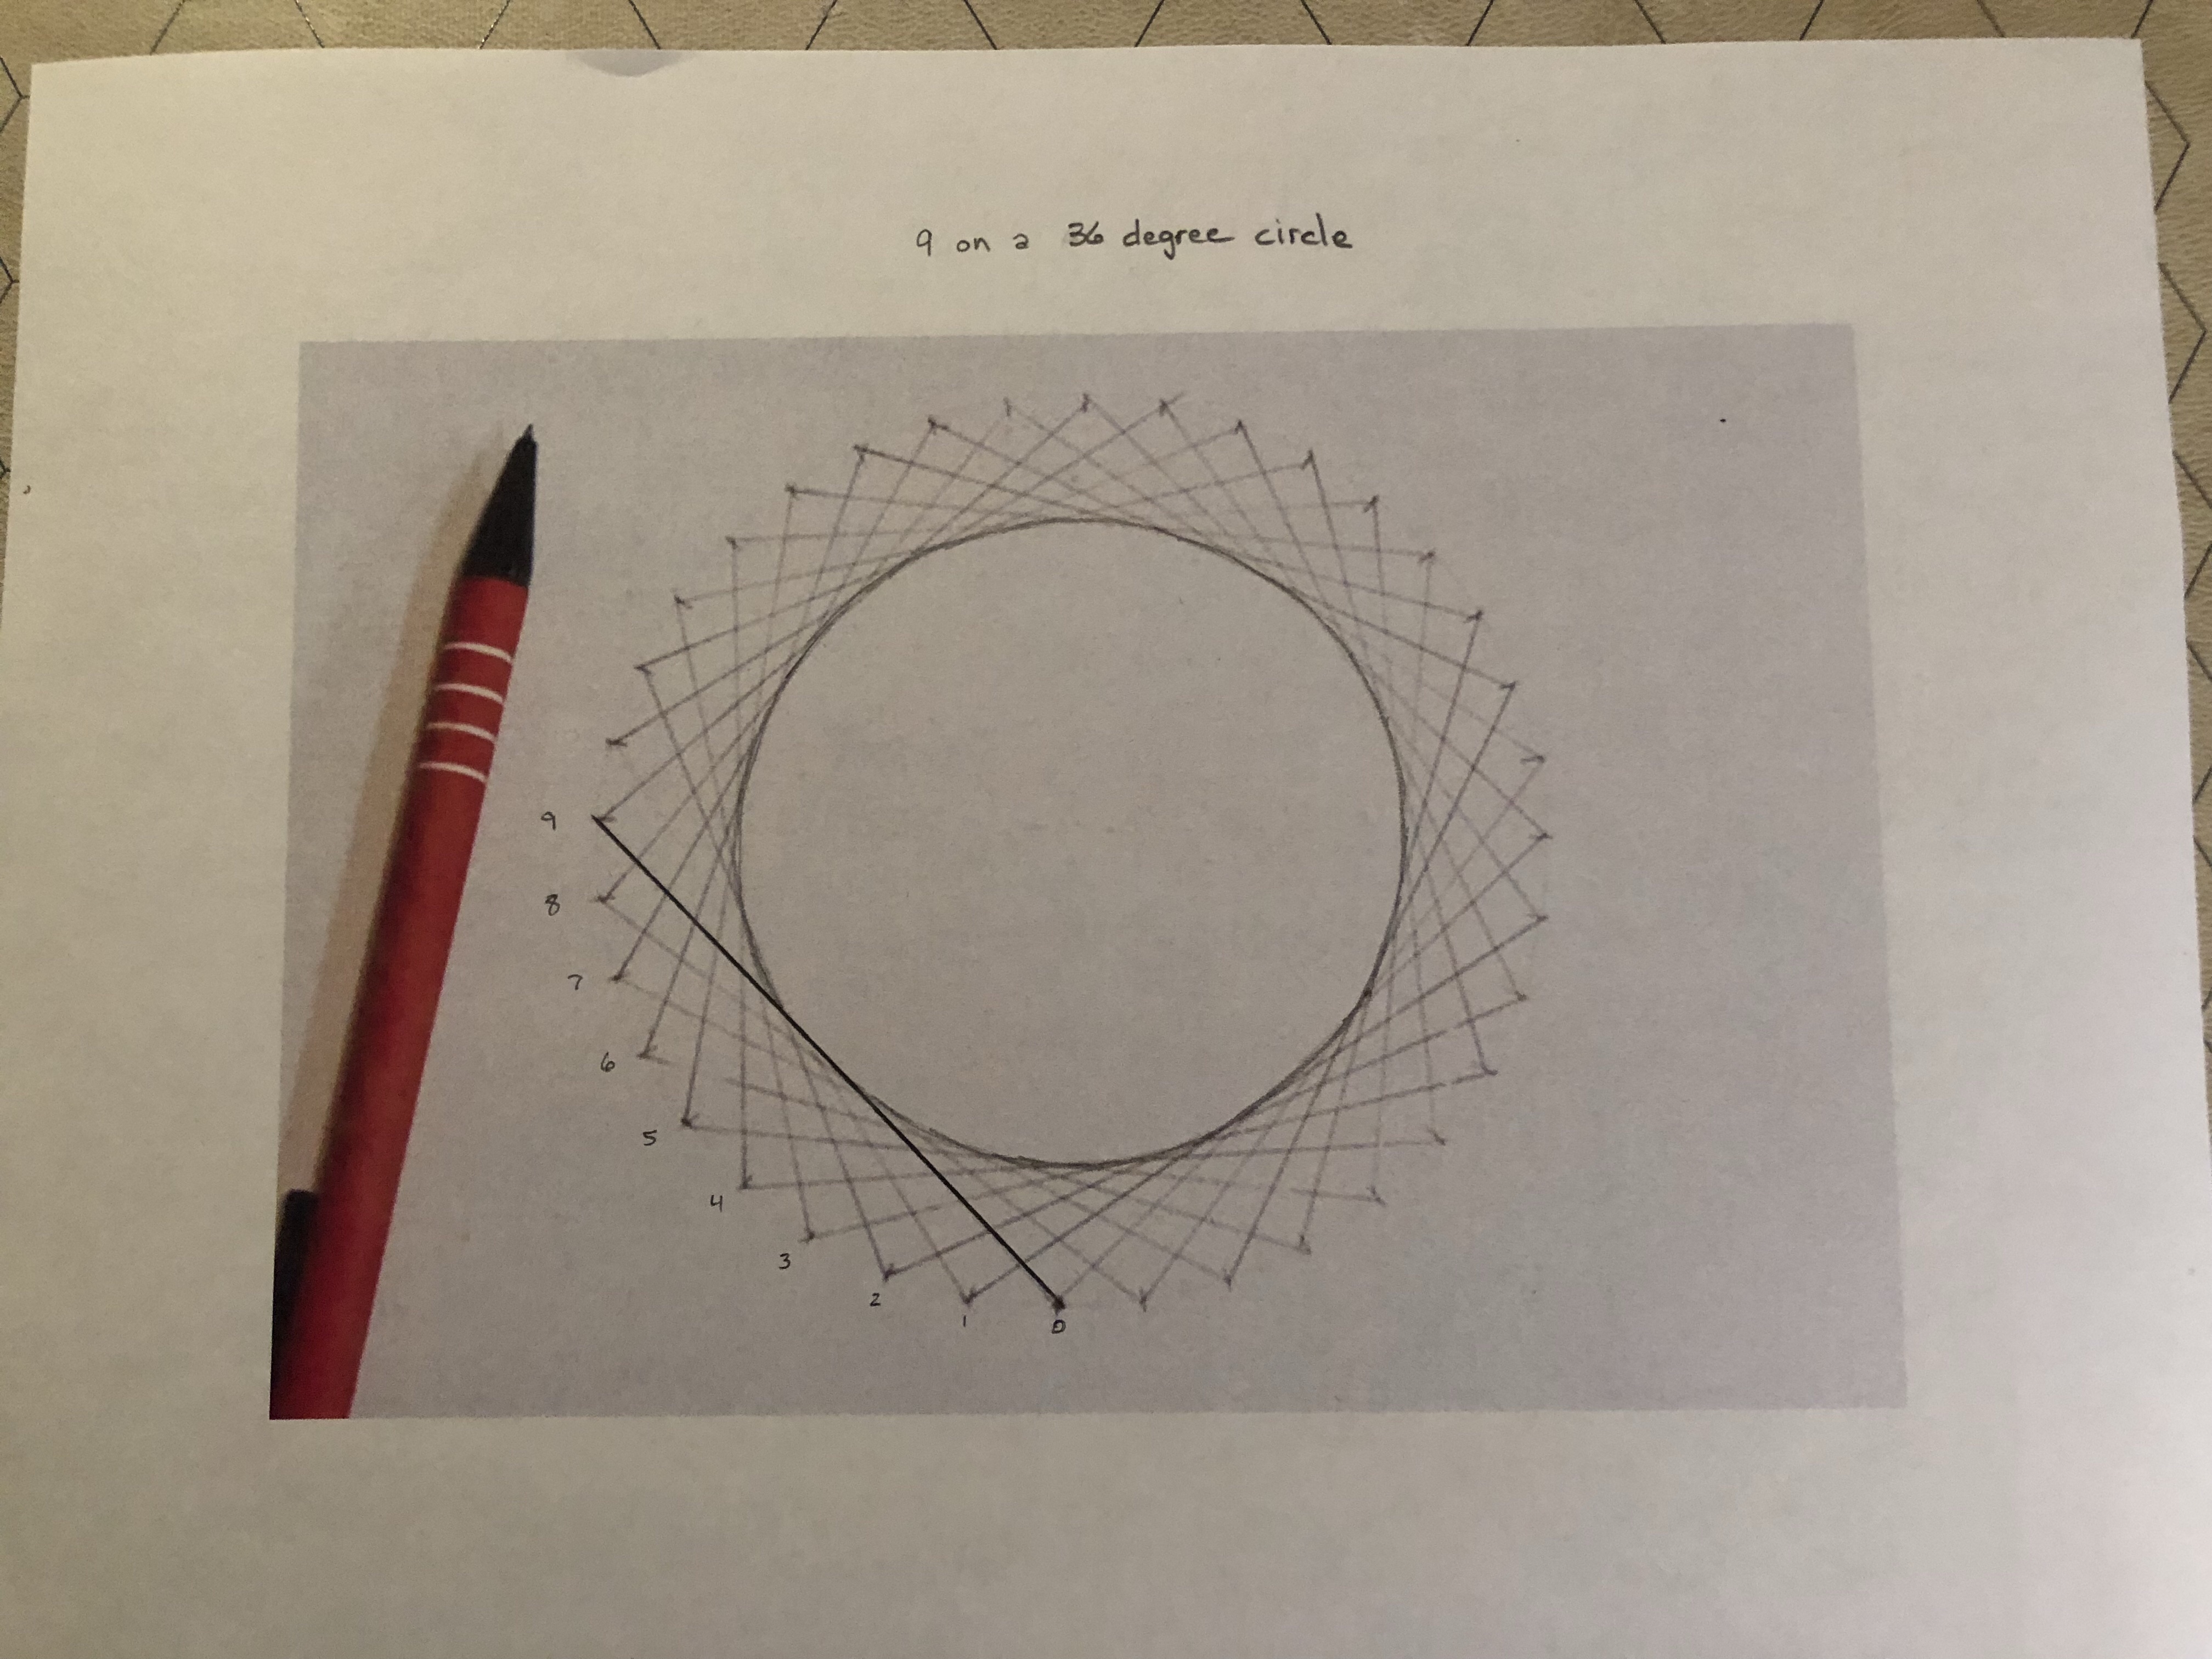
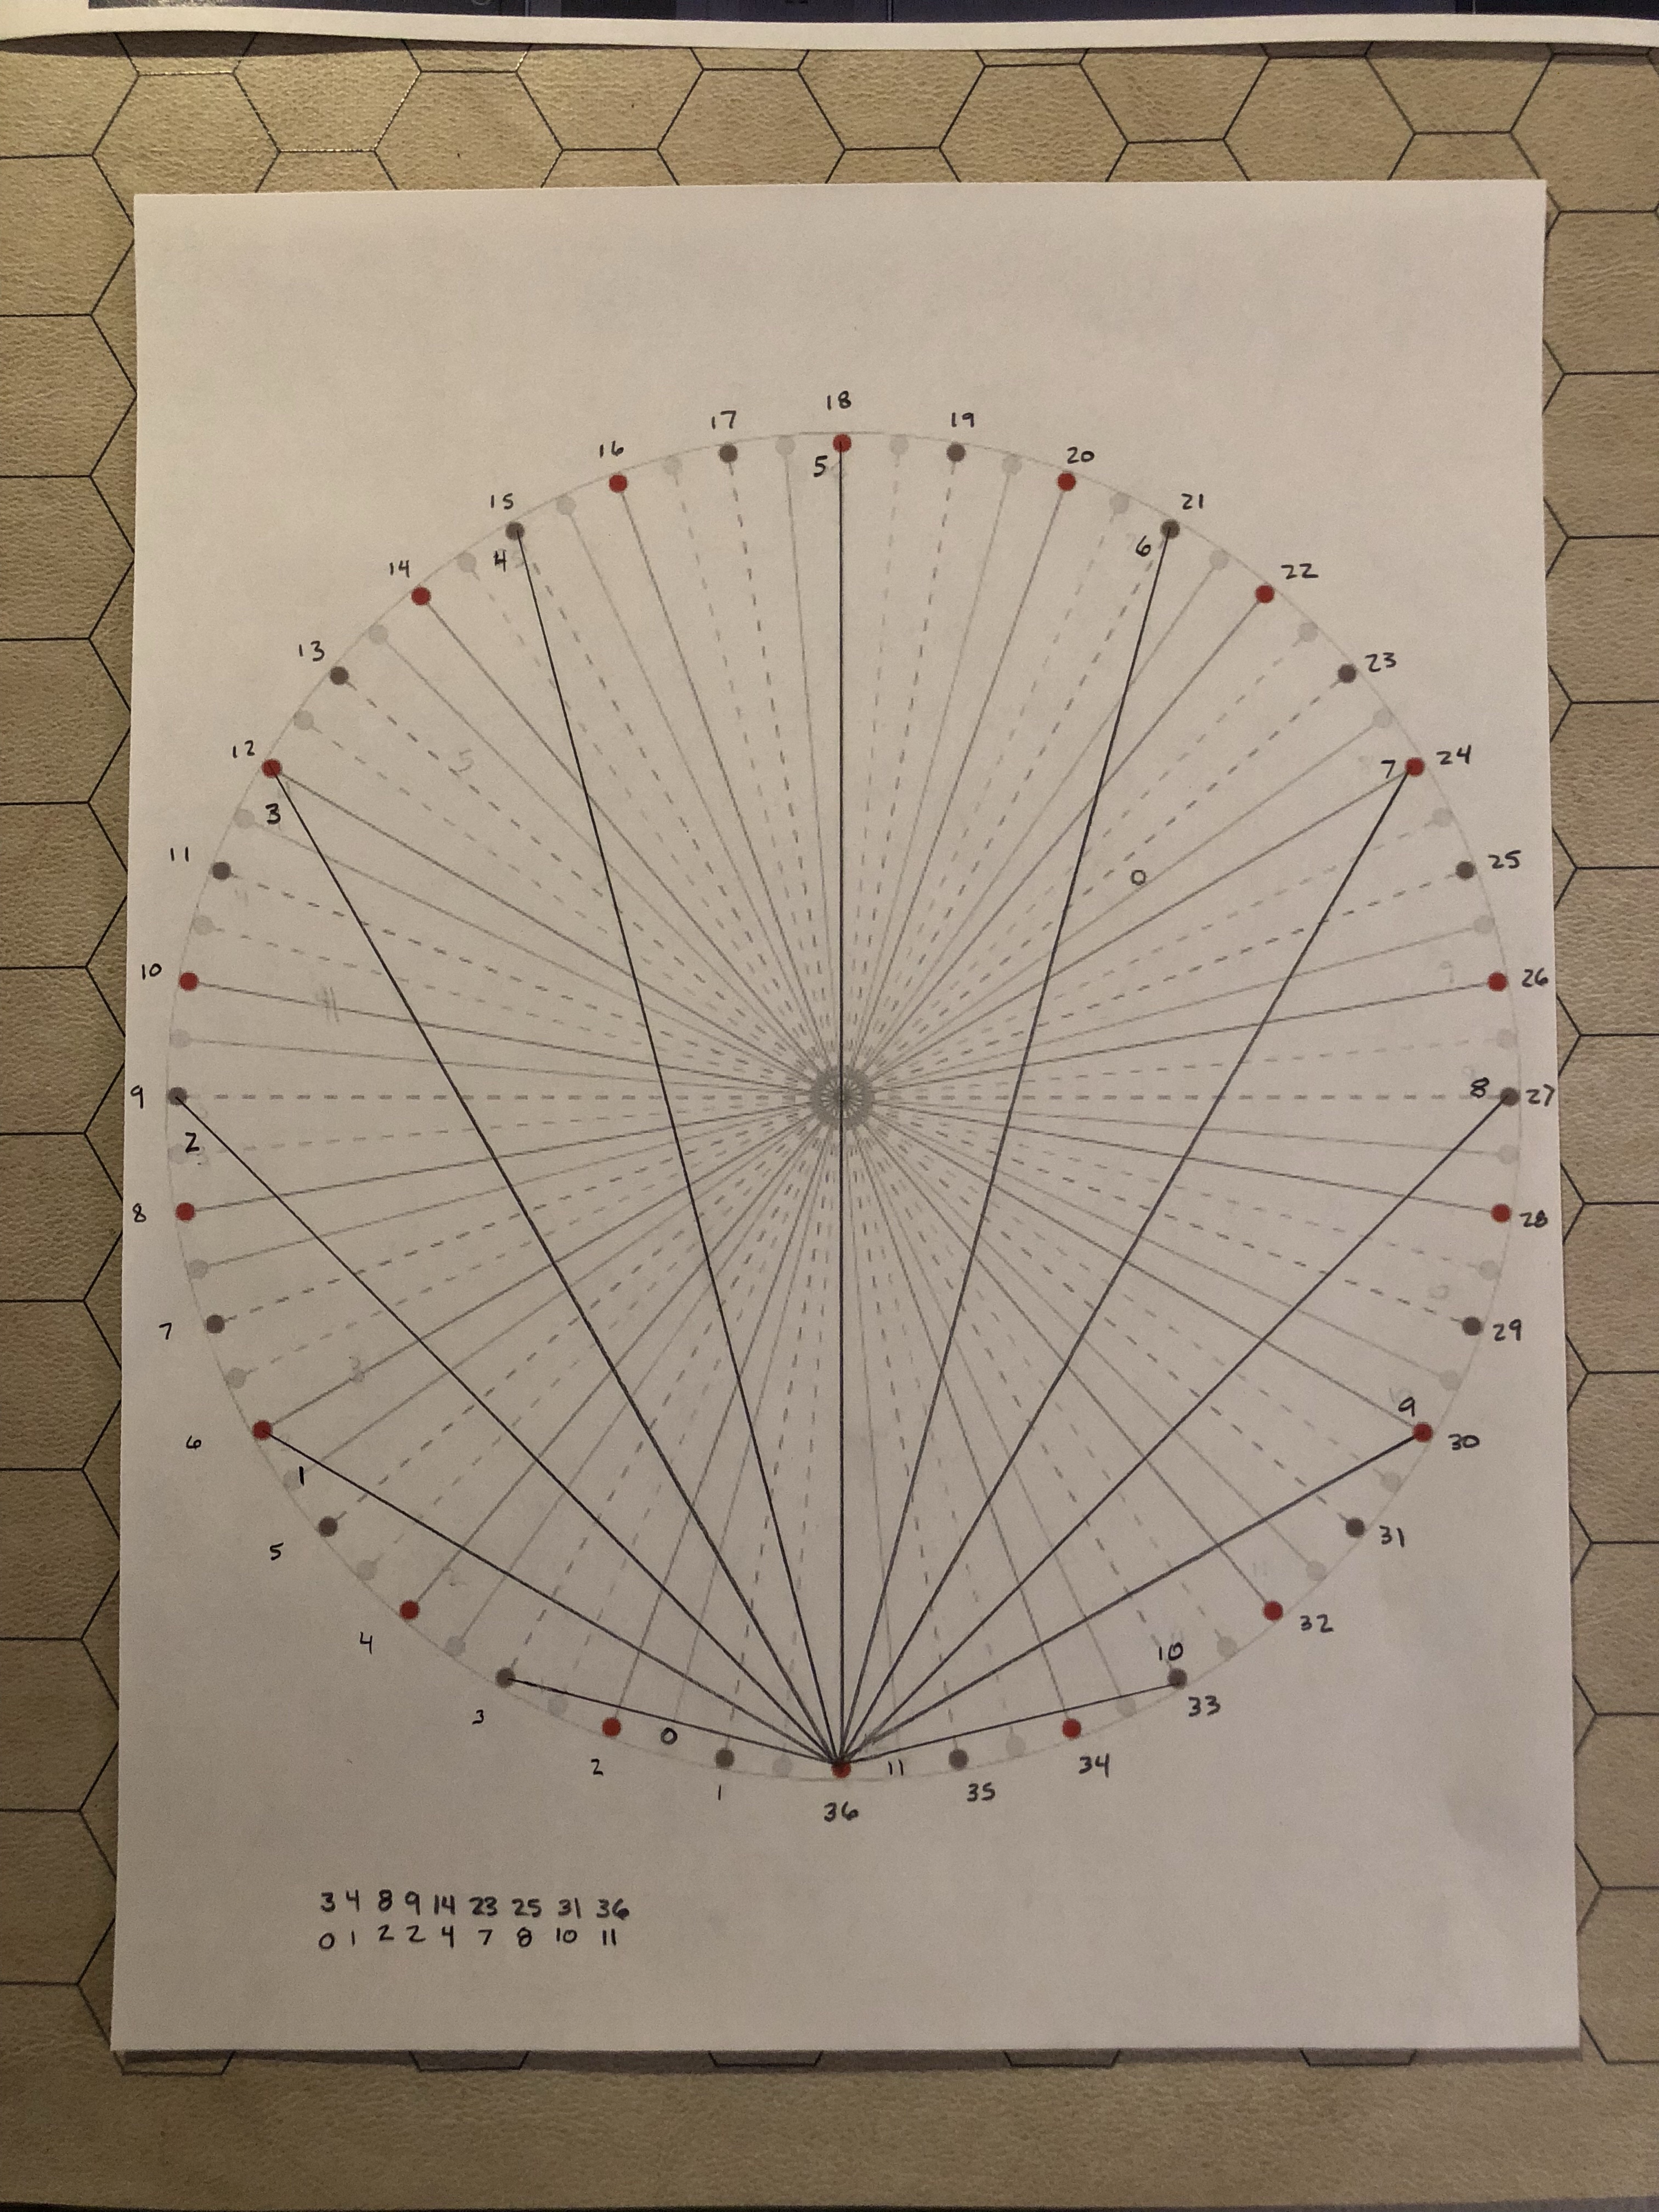
We’ll be using a 36-degree circle, so it helps to understand how these 36 nodes will be counted. For these examples, we’ll always be using the bottom node as our Starting Point (the node in the South direction, or in the 6 o’clock position. Instead of counting the Starting Point as “1”, however, we consider it to be “0”.
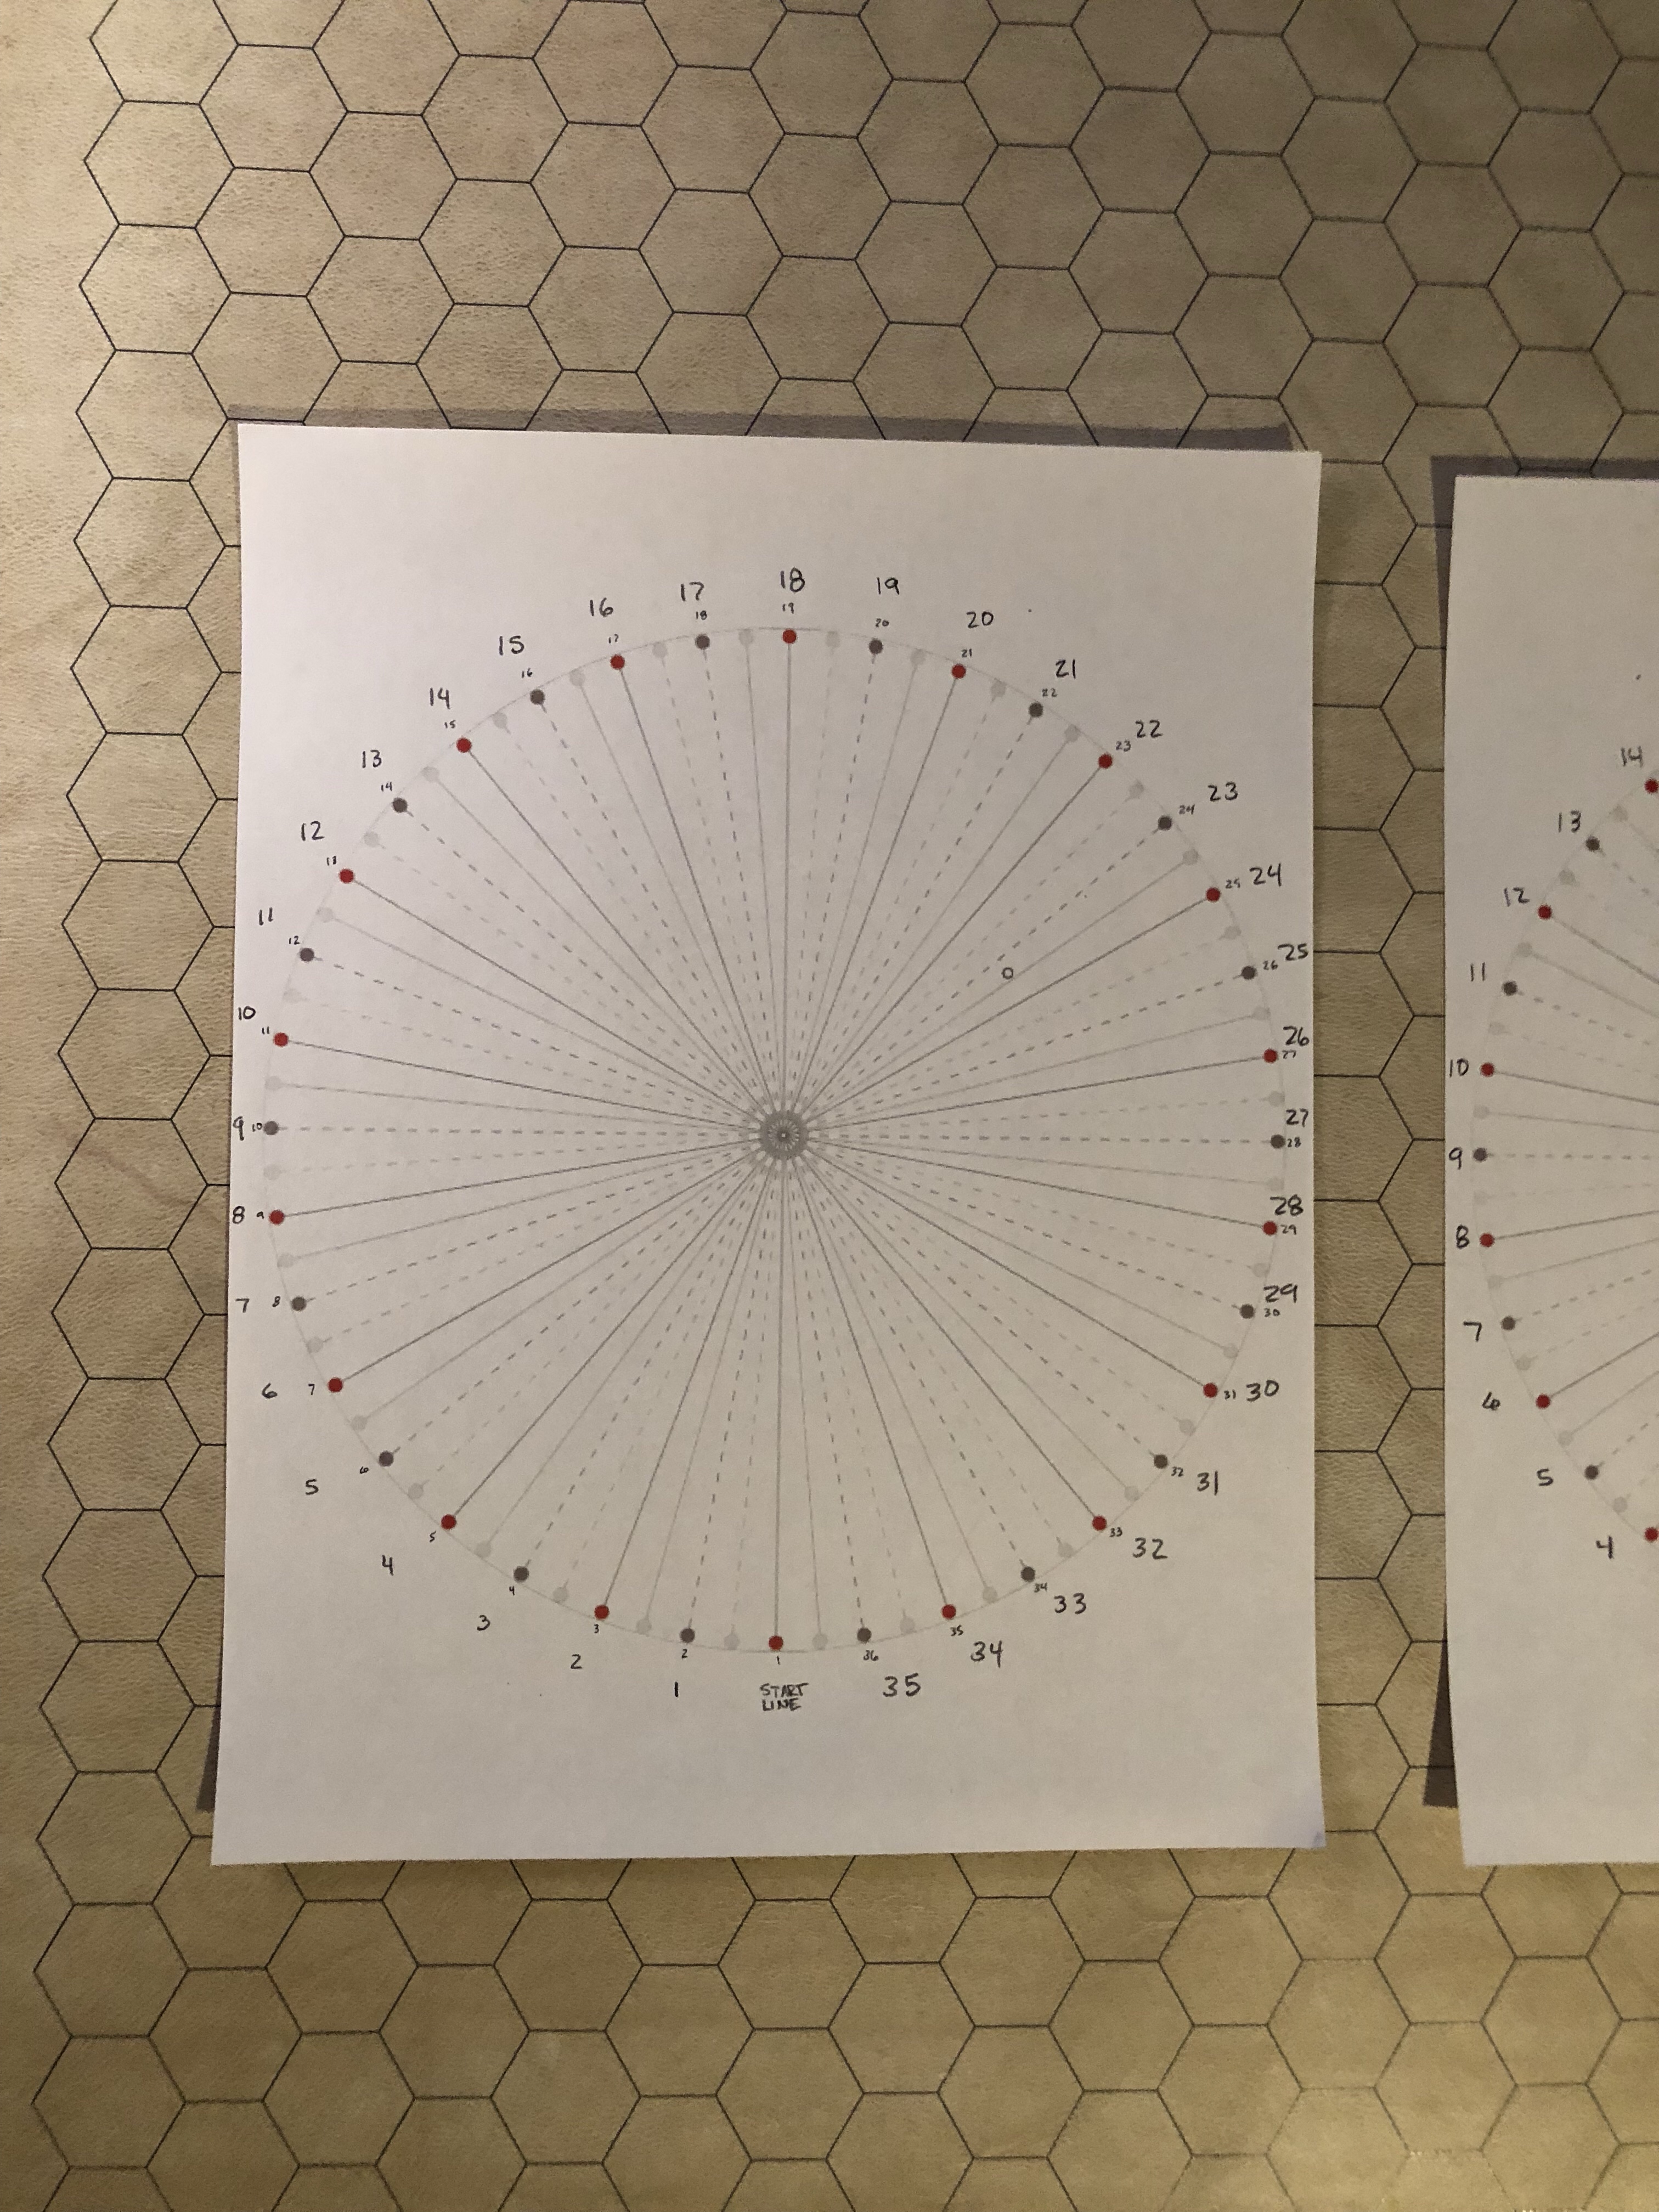
Notice that when you count up one side of the circle that the lines grow longer until you reach the number “18”, which is directly opposite node “0”, and then the lines become shorter incrementally again as you count higher. In essence, the numbers 1-17 all have a corollary number 19-35 so that the distance from 0 to 1 is the same in length as 0 to 35. In the same way, 0 to 2 is the same as 0 to 34, etc.
With all this in mind, it will help to view the next two links and learn about the Cardioid.
In creating a Cardioid on a 36-degree circle, each step in the process creates just one instance of a particular number that is always of the formula n = n x 2. This pattern creates a mirrored spiral across the even numbers where the lines grow to node 18 and then shrink again as the numbers go higher.
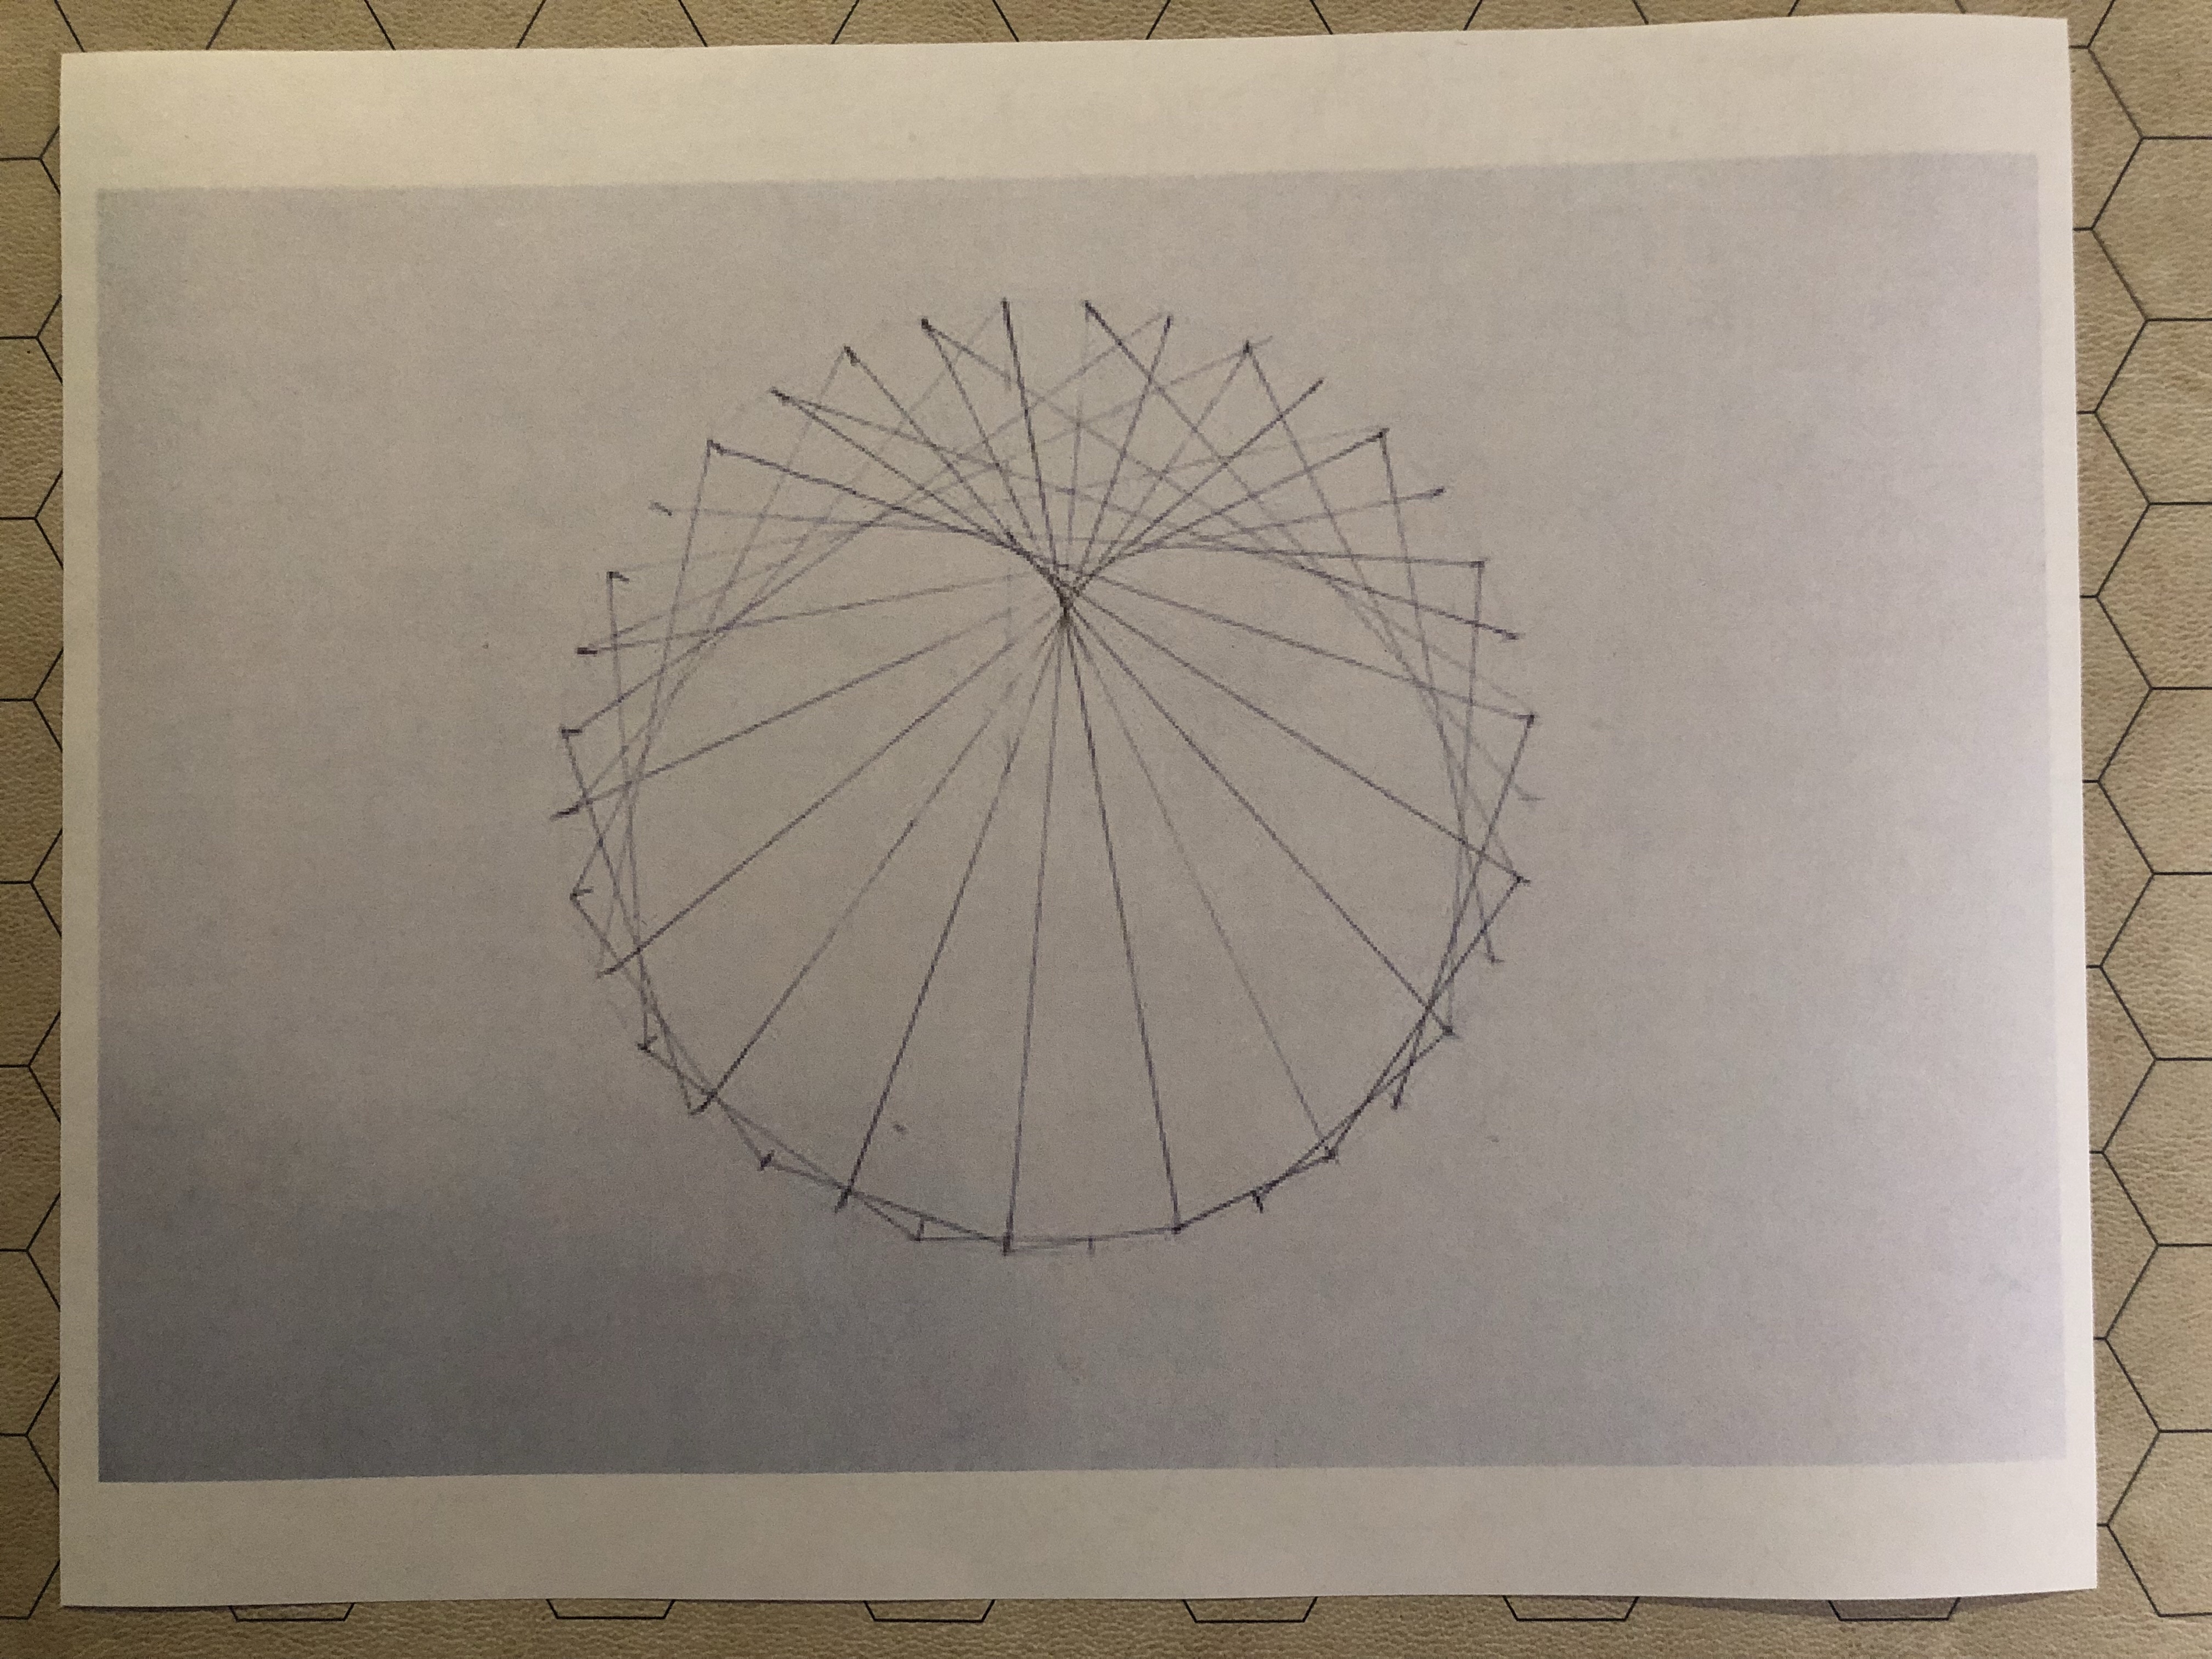
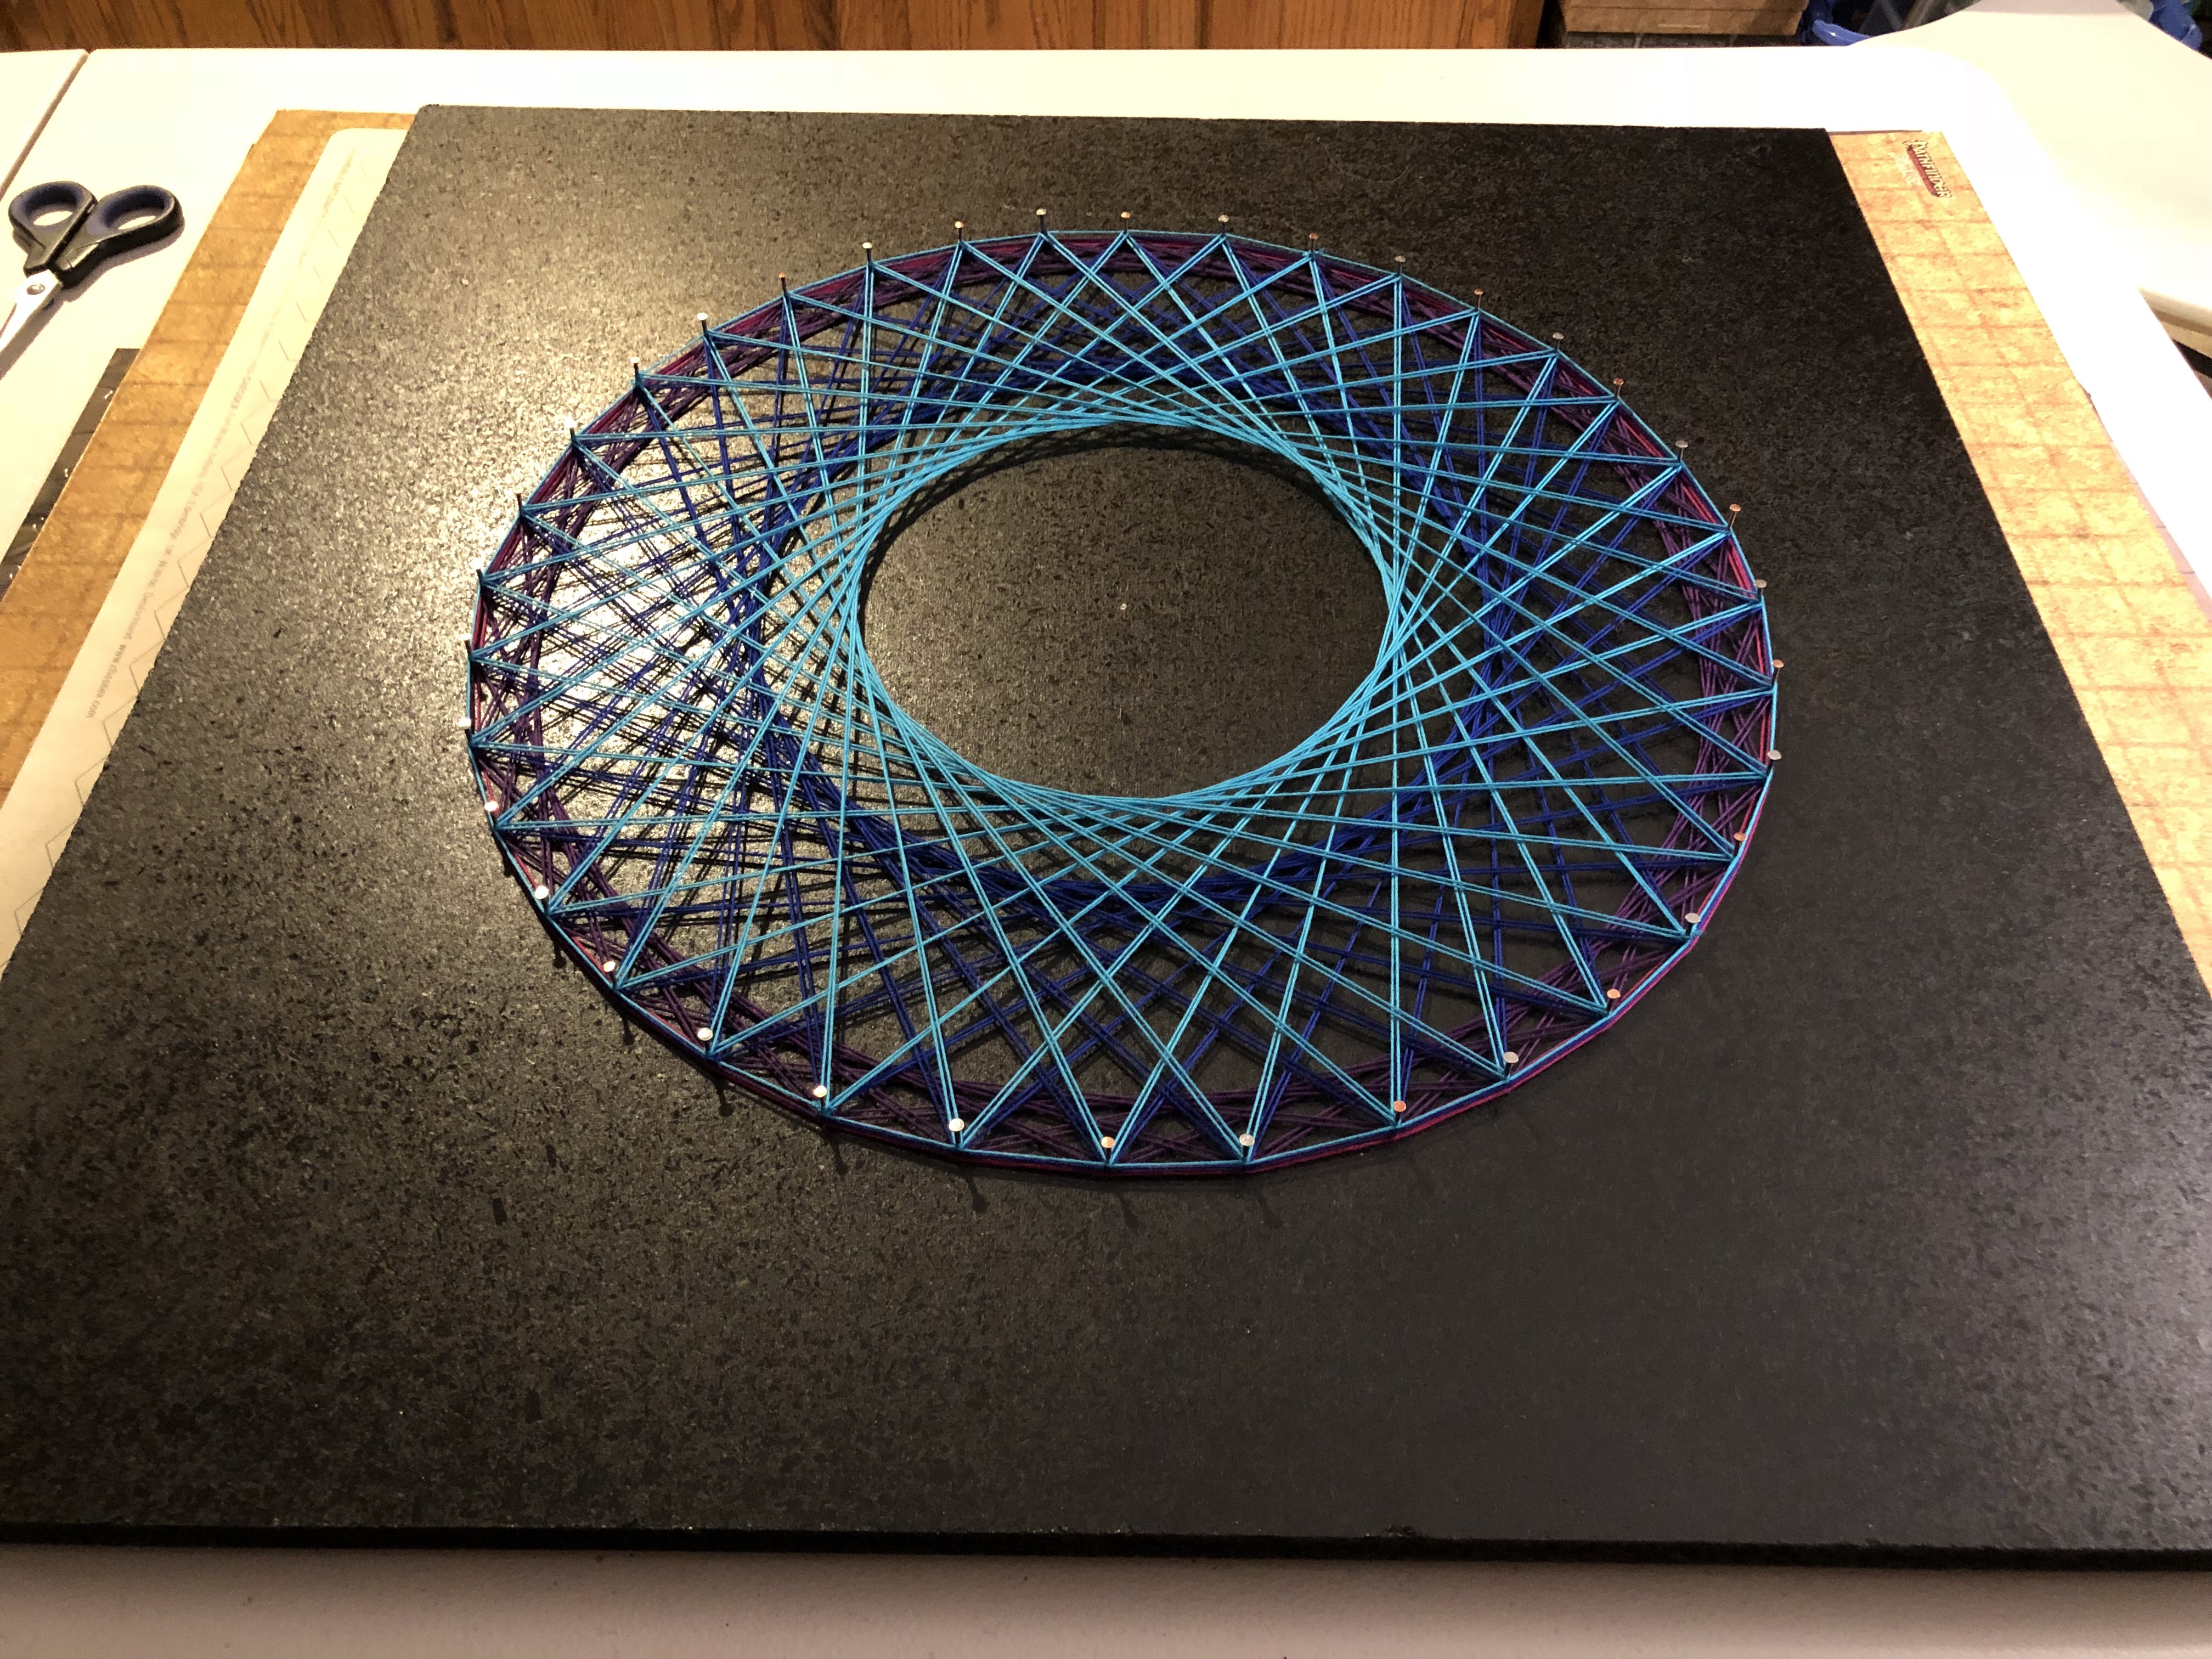
But let us now consider the act of creating a line from every single node of the same number over and over. Take for example the number “9”. When the number “9” is fully mapped around the circle, a smaller circle appears. This circle of the number “9” is actually formed out of the half-way points of every single line.
But also notice that the number “9” corresponds to the number “27”. Before we move on to a method to differentiate such cases of corollary numbers, let’s take a look at what the number sequence of 3, 4, 8, 9, 14, 23, 25, 31, and 36 looks like when plotted in number circles within a 36-degree circle in pencil.
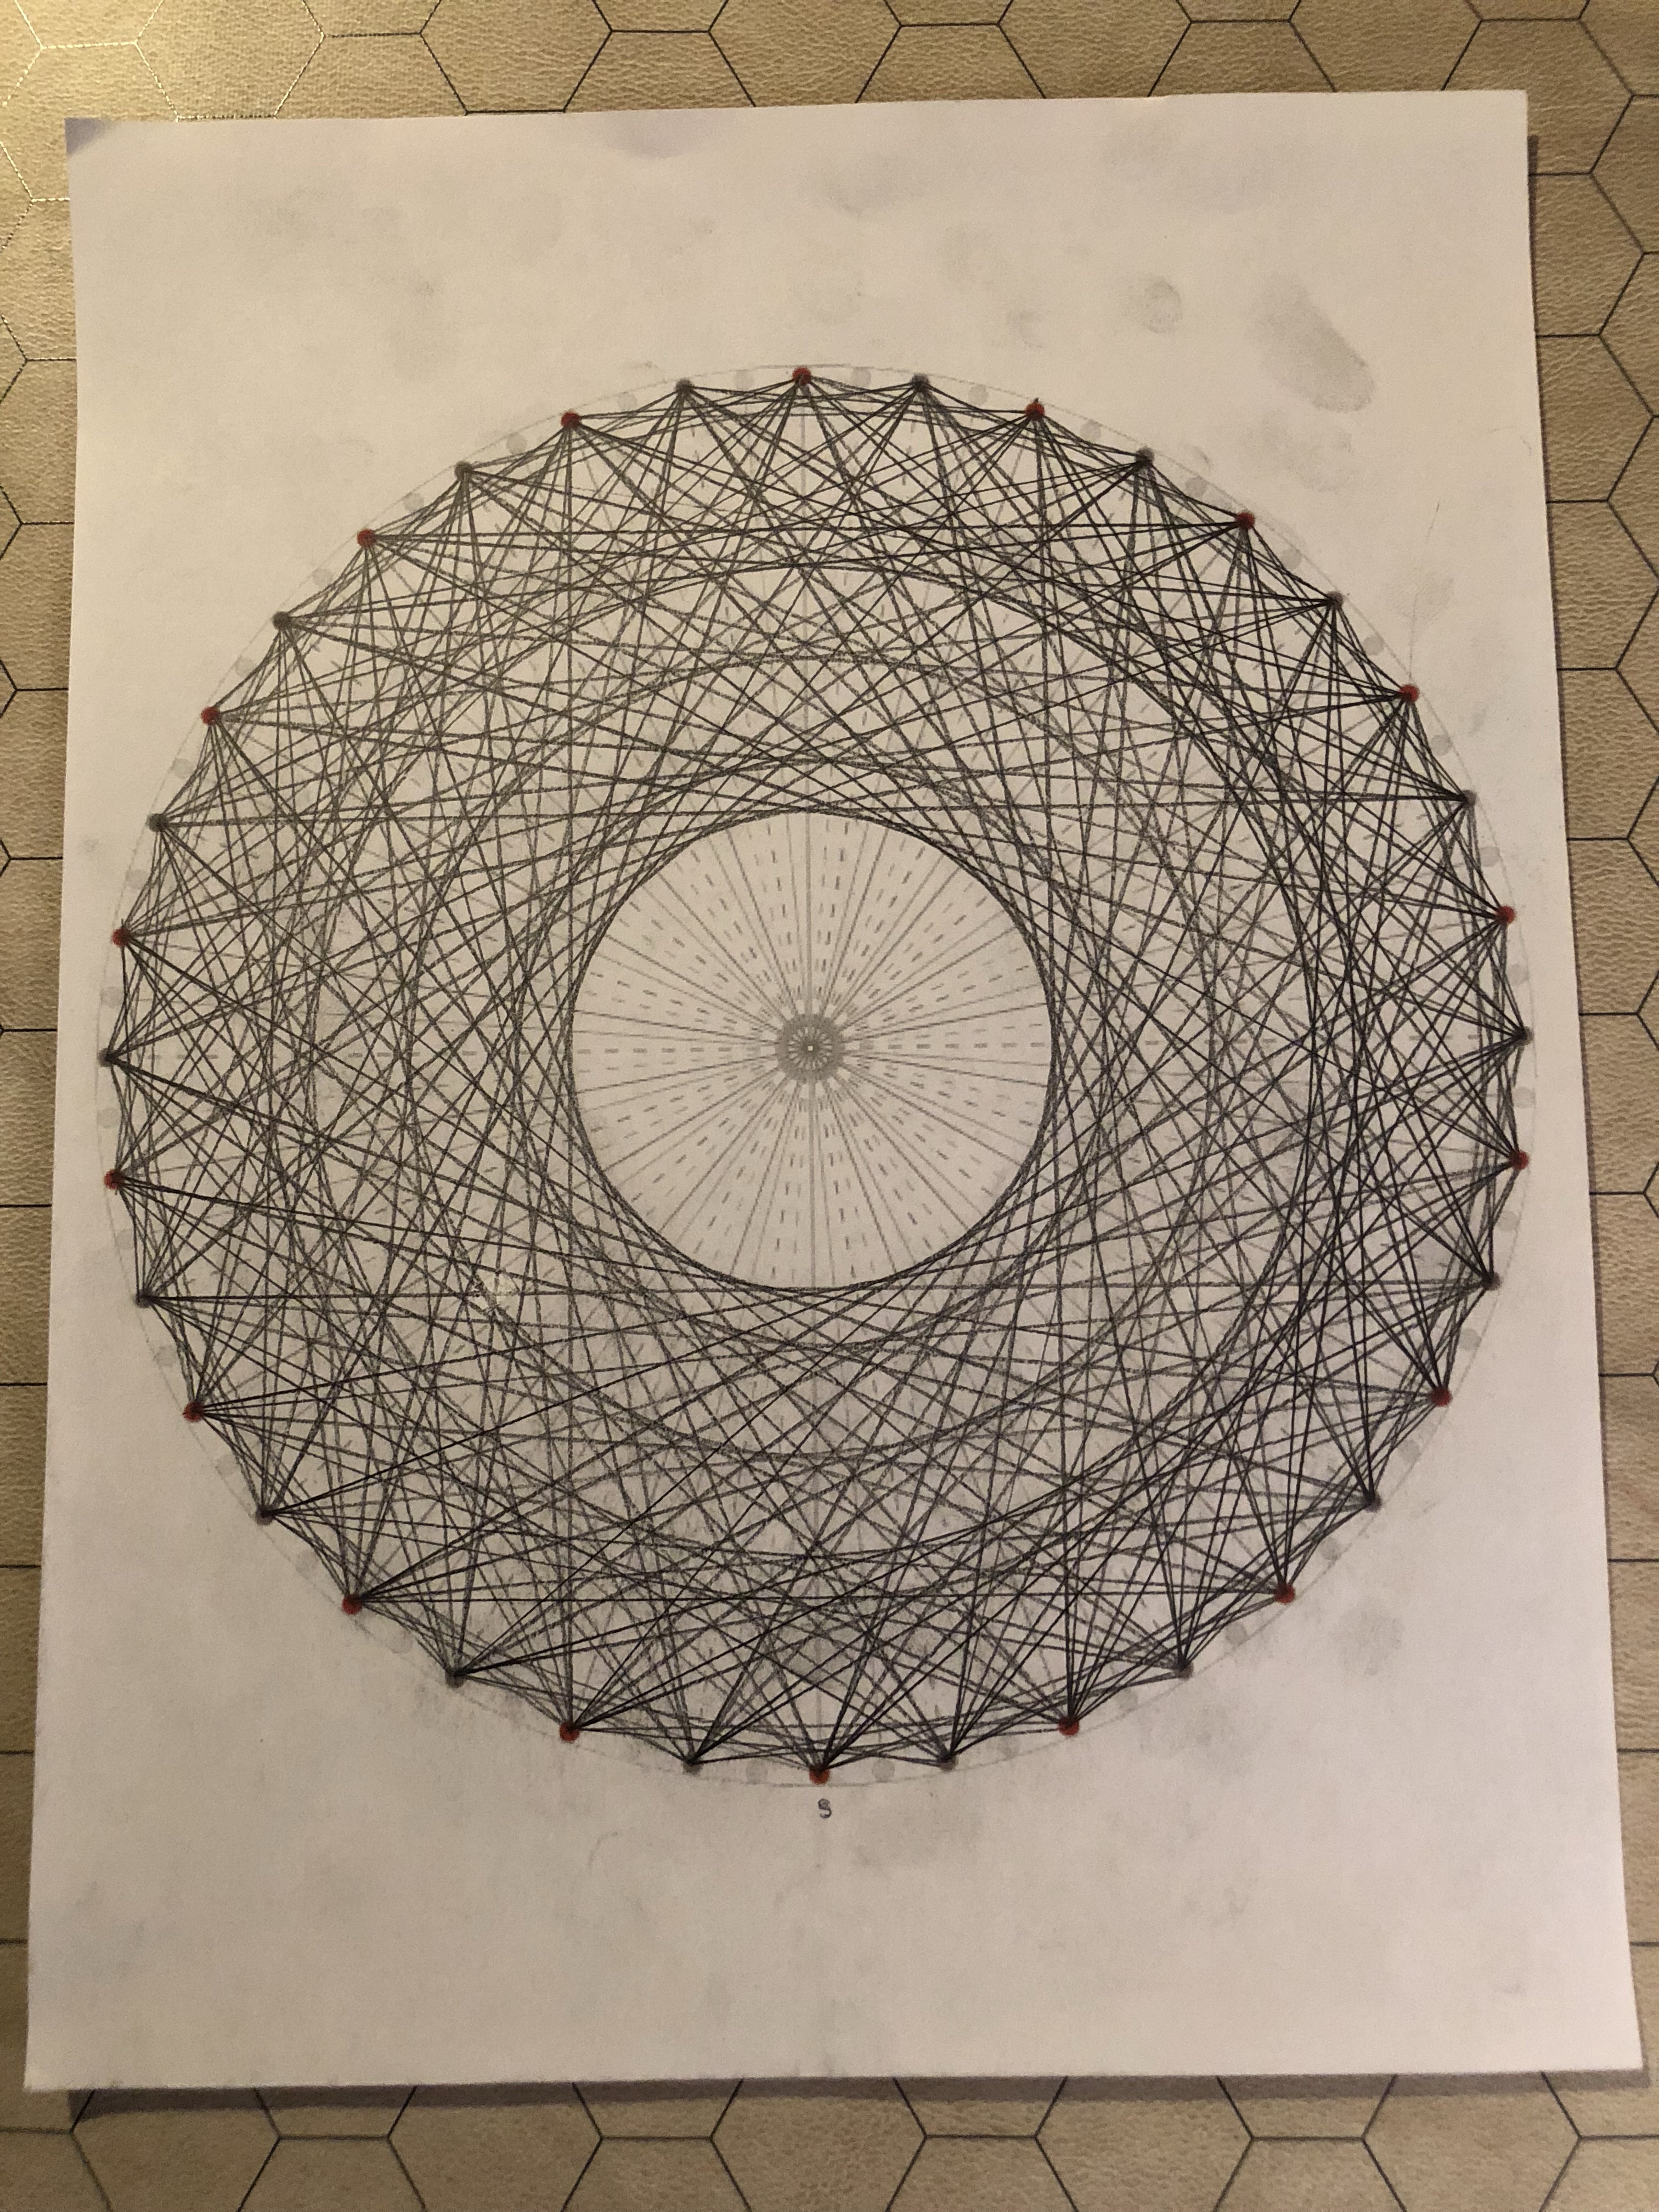
The pencil version looks pretty amazing, but presents a problem with higher numbers that might get confused with or even overlay lower numbers.
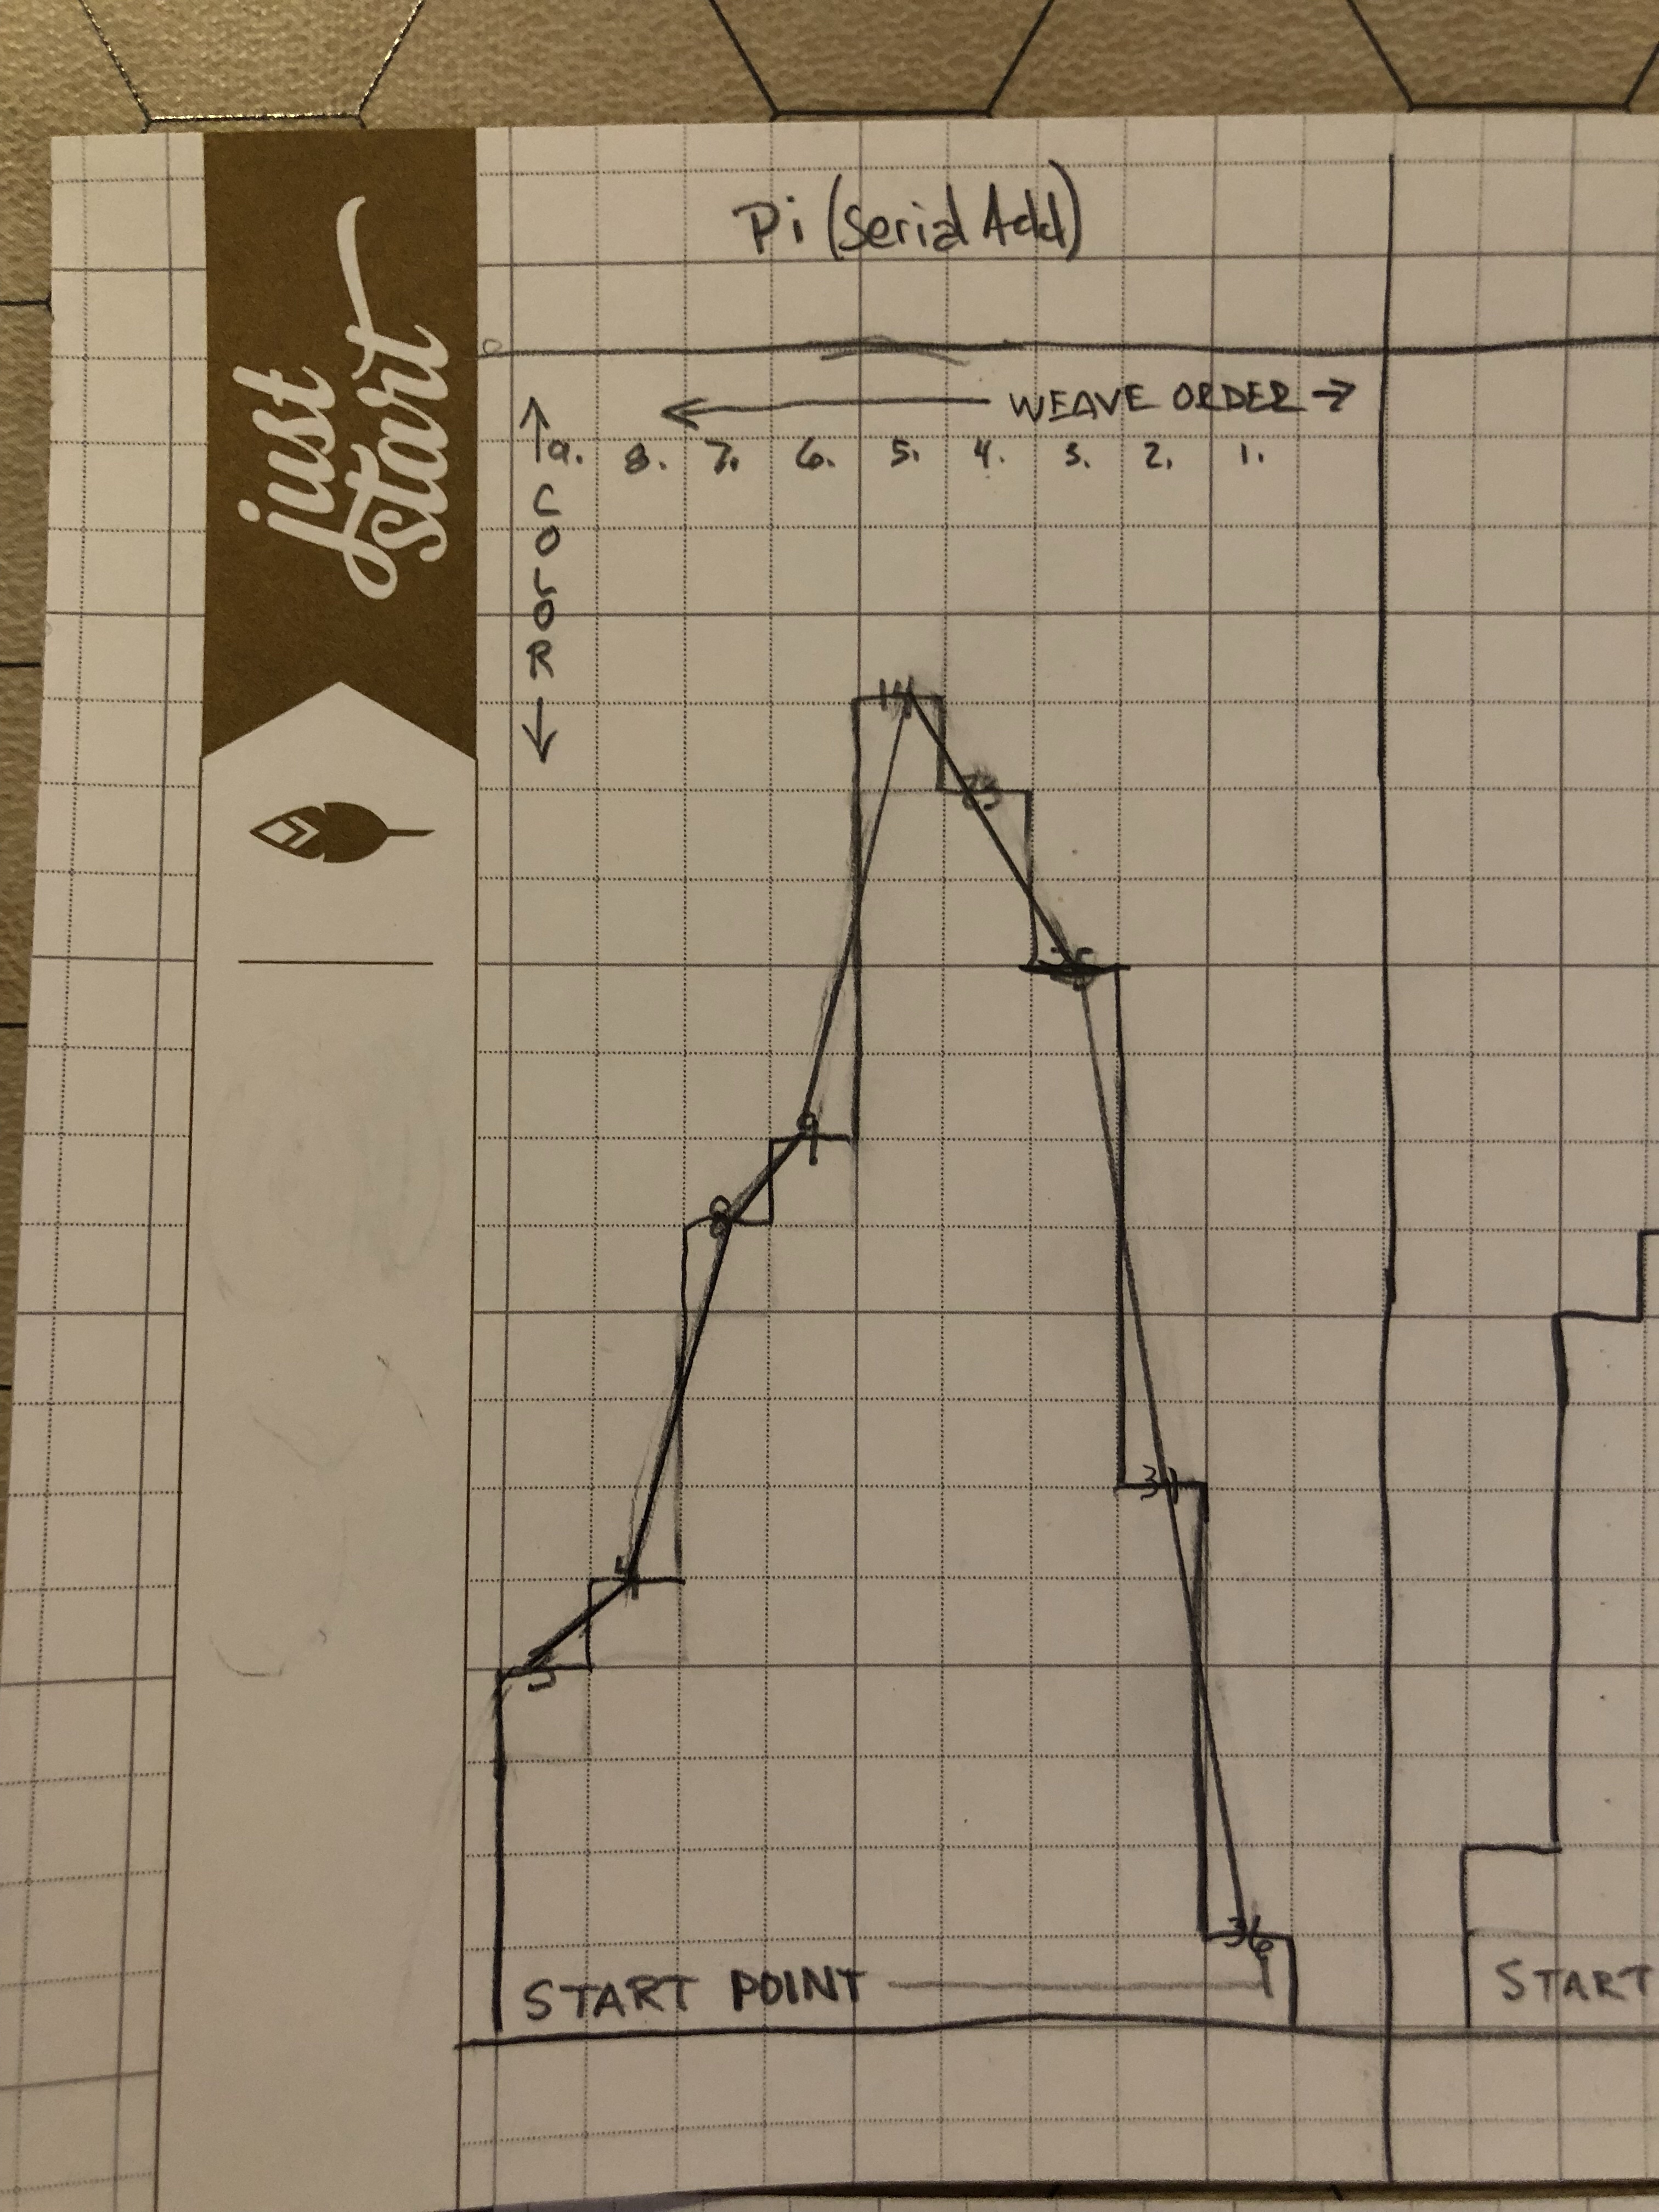
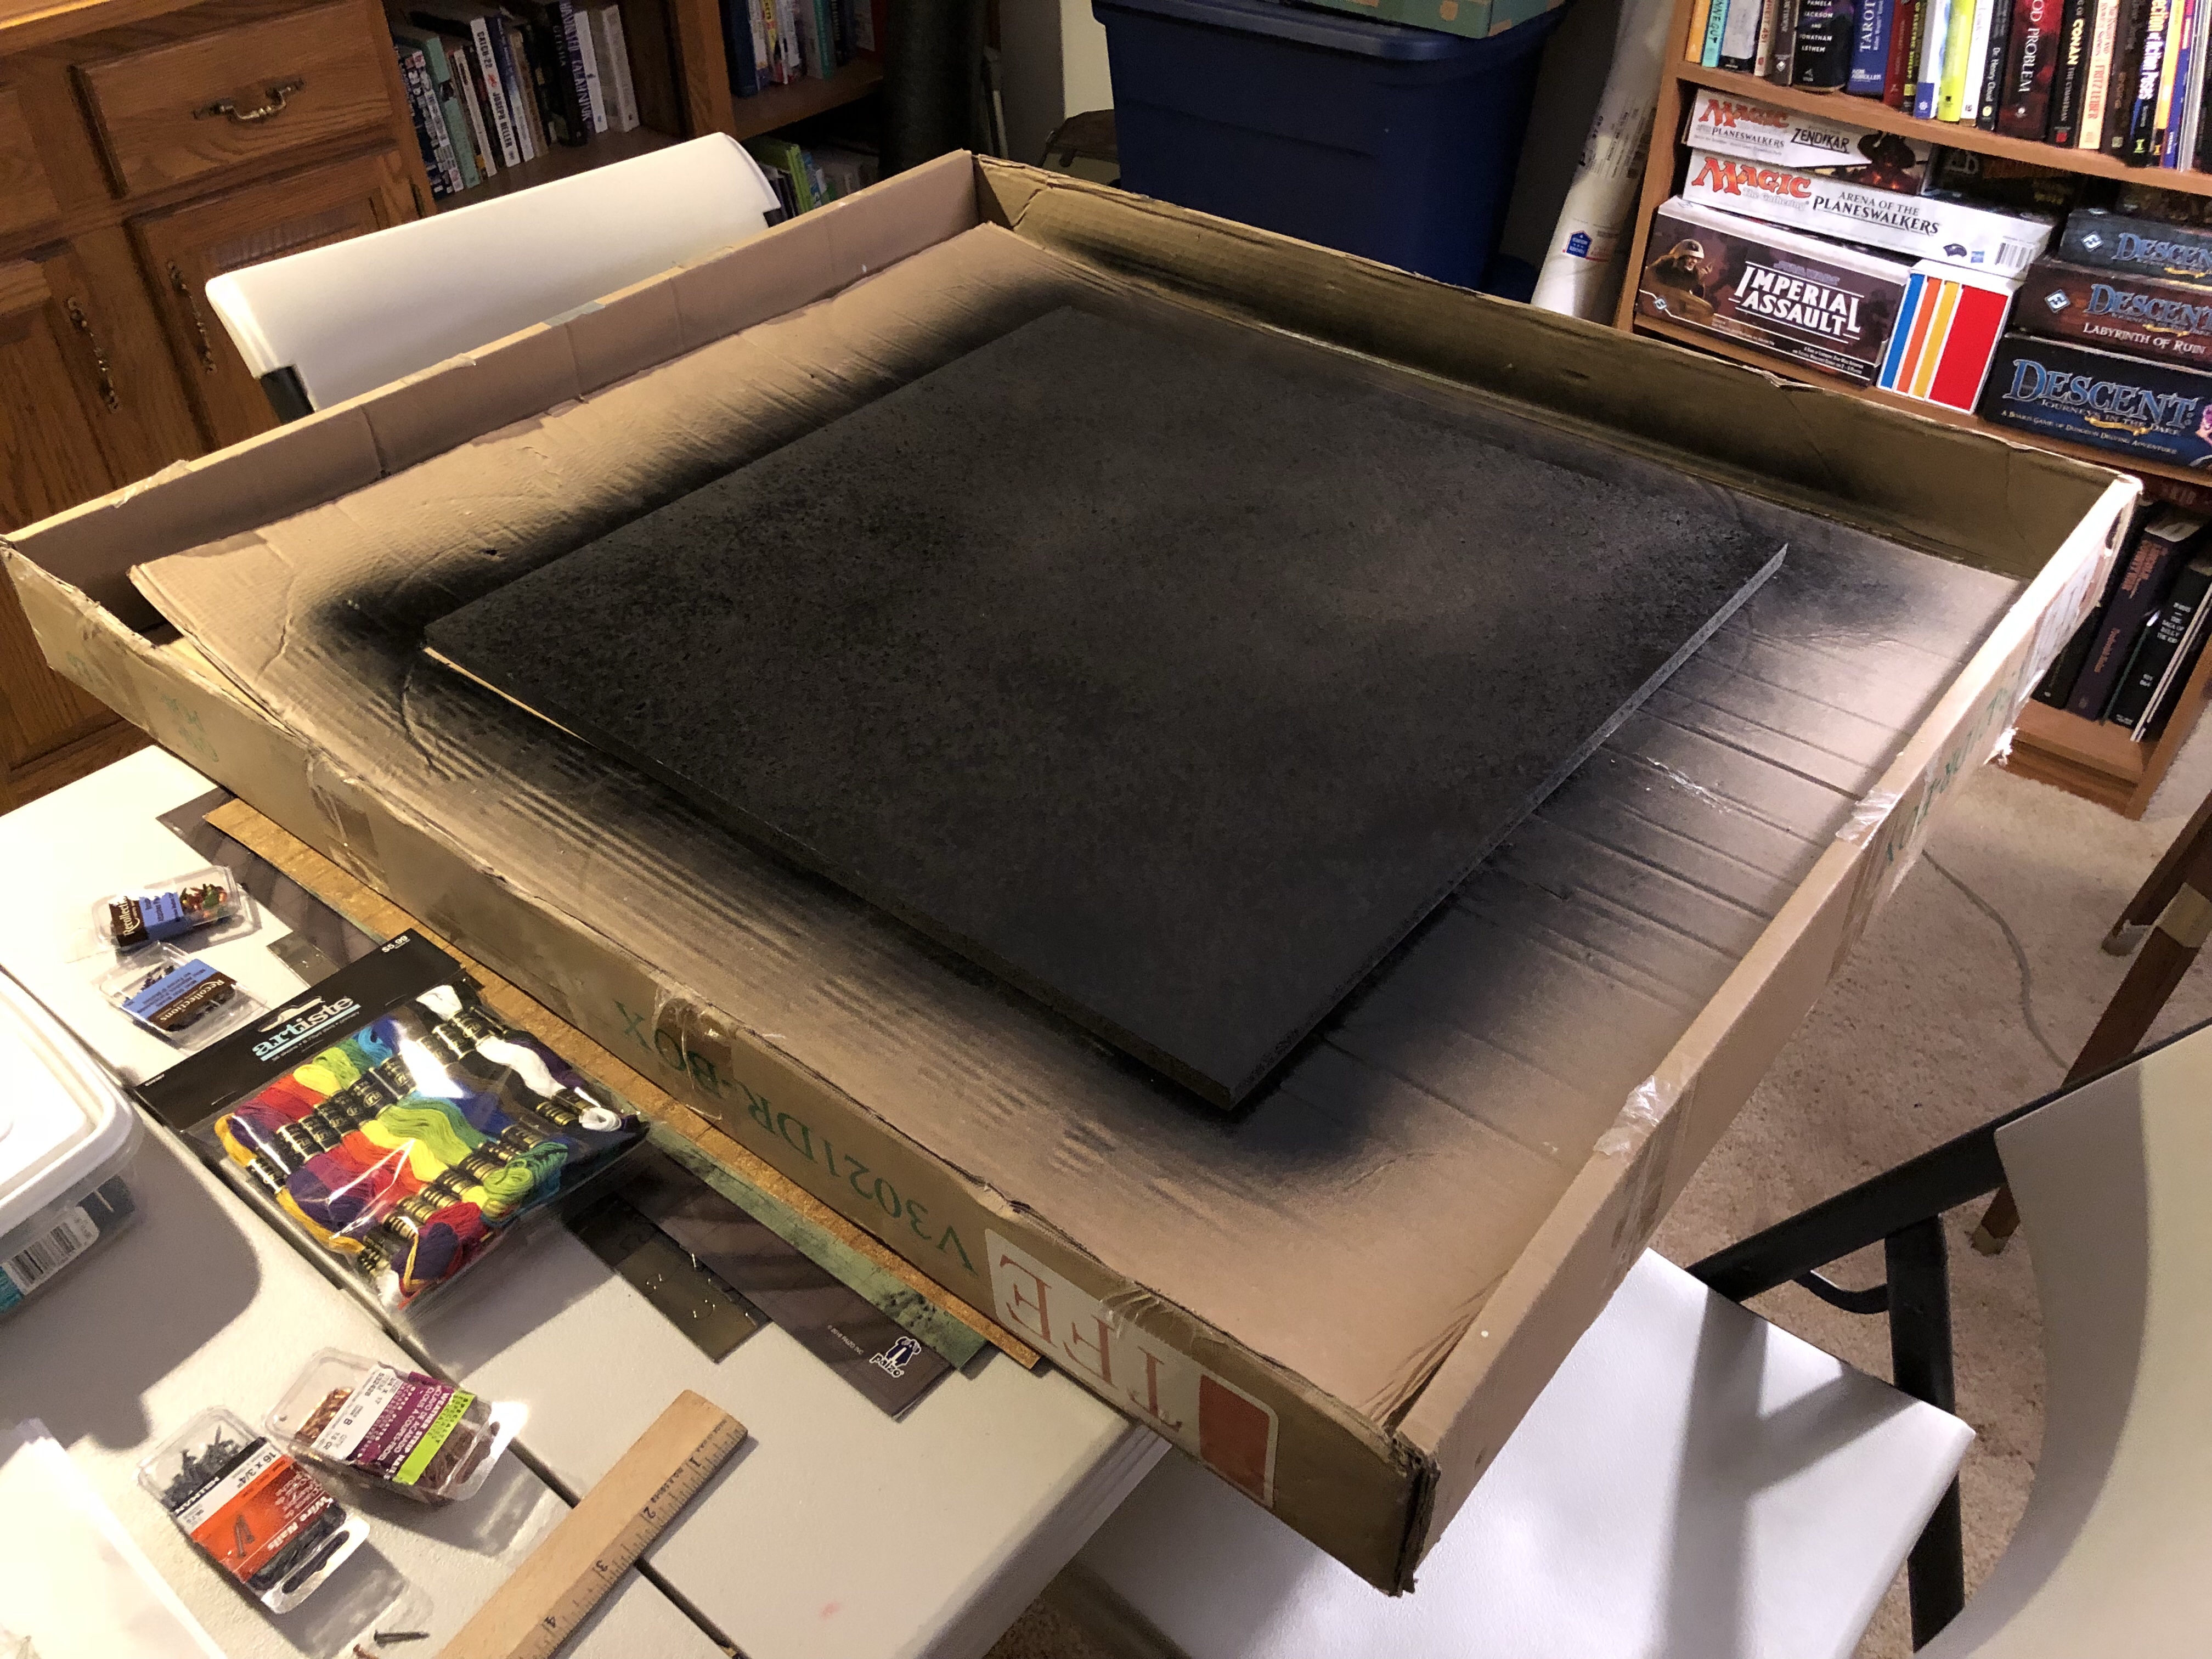
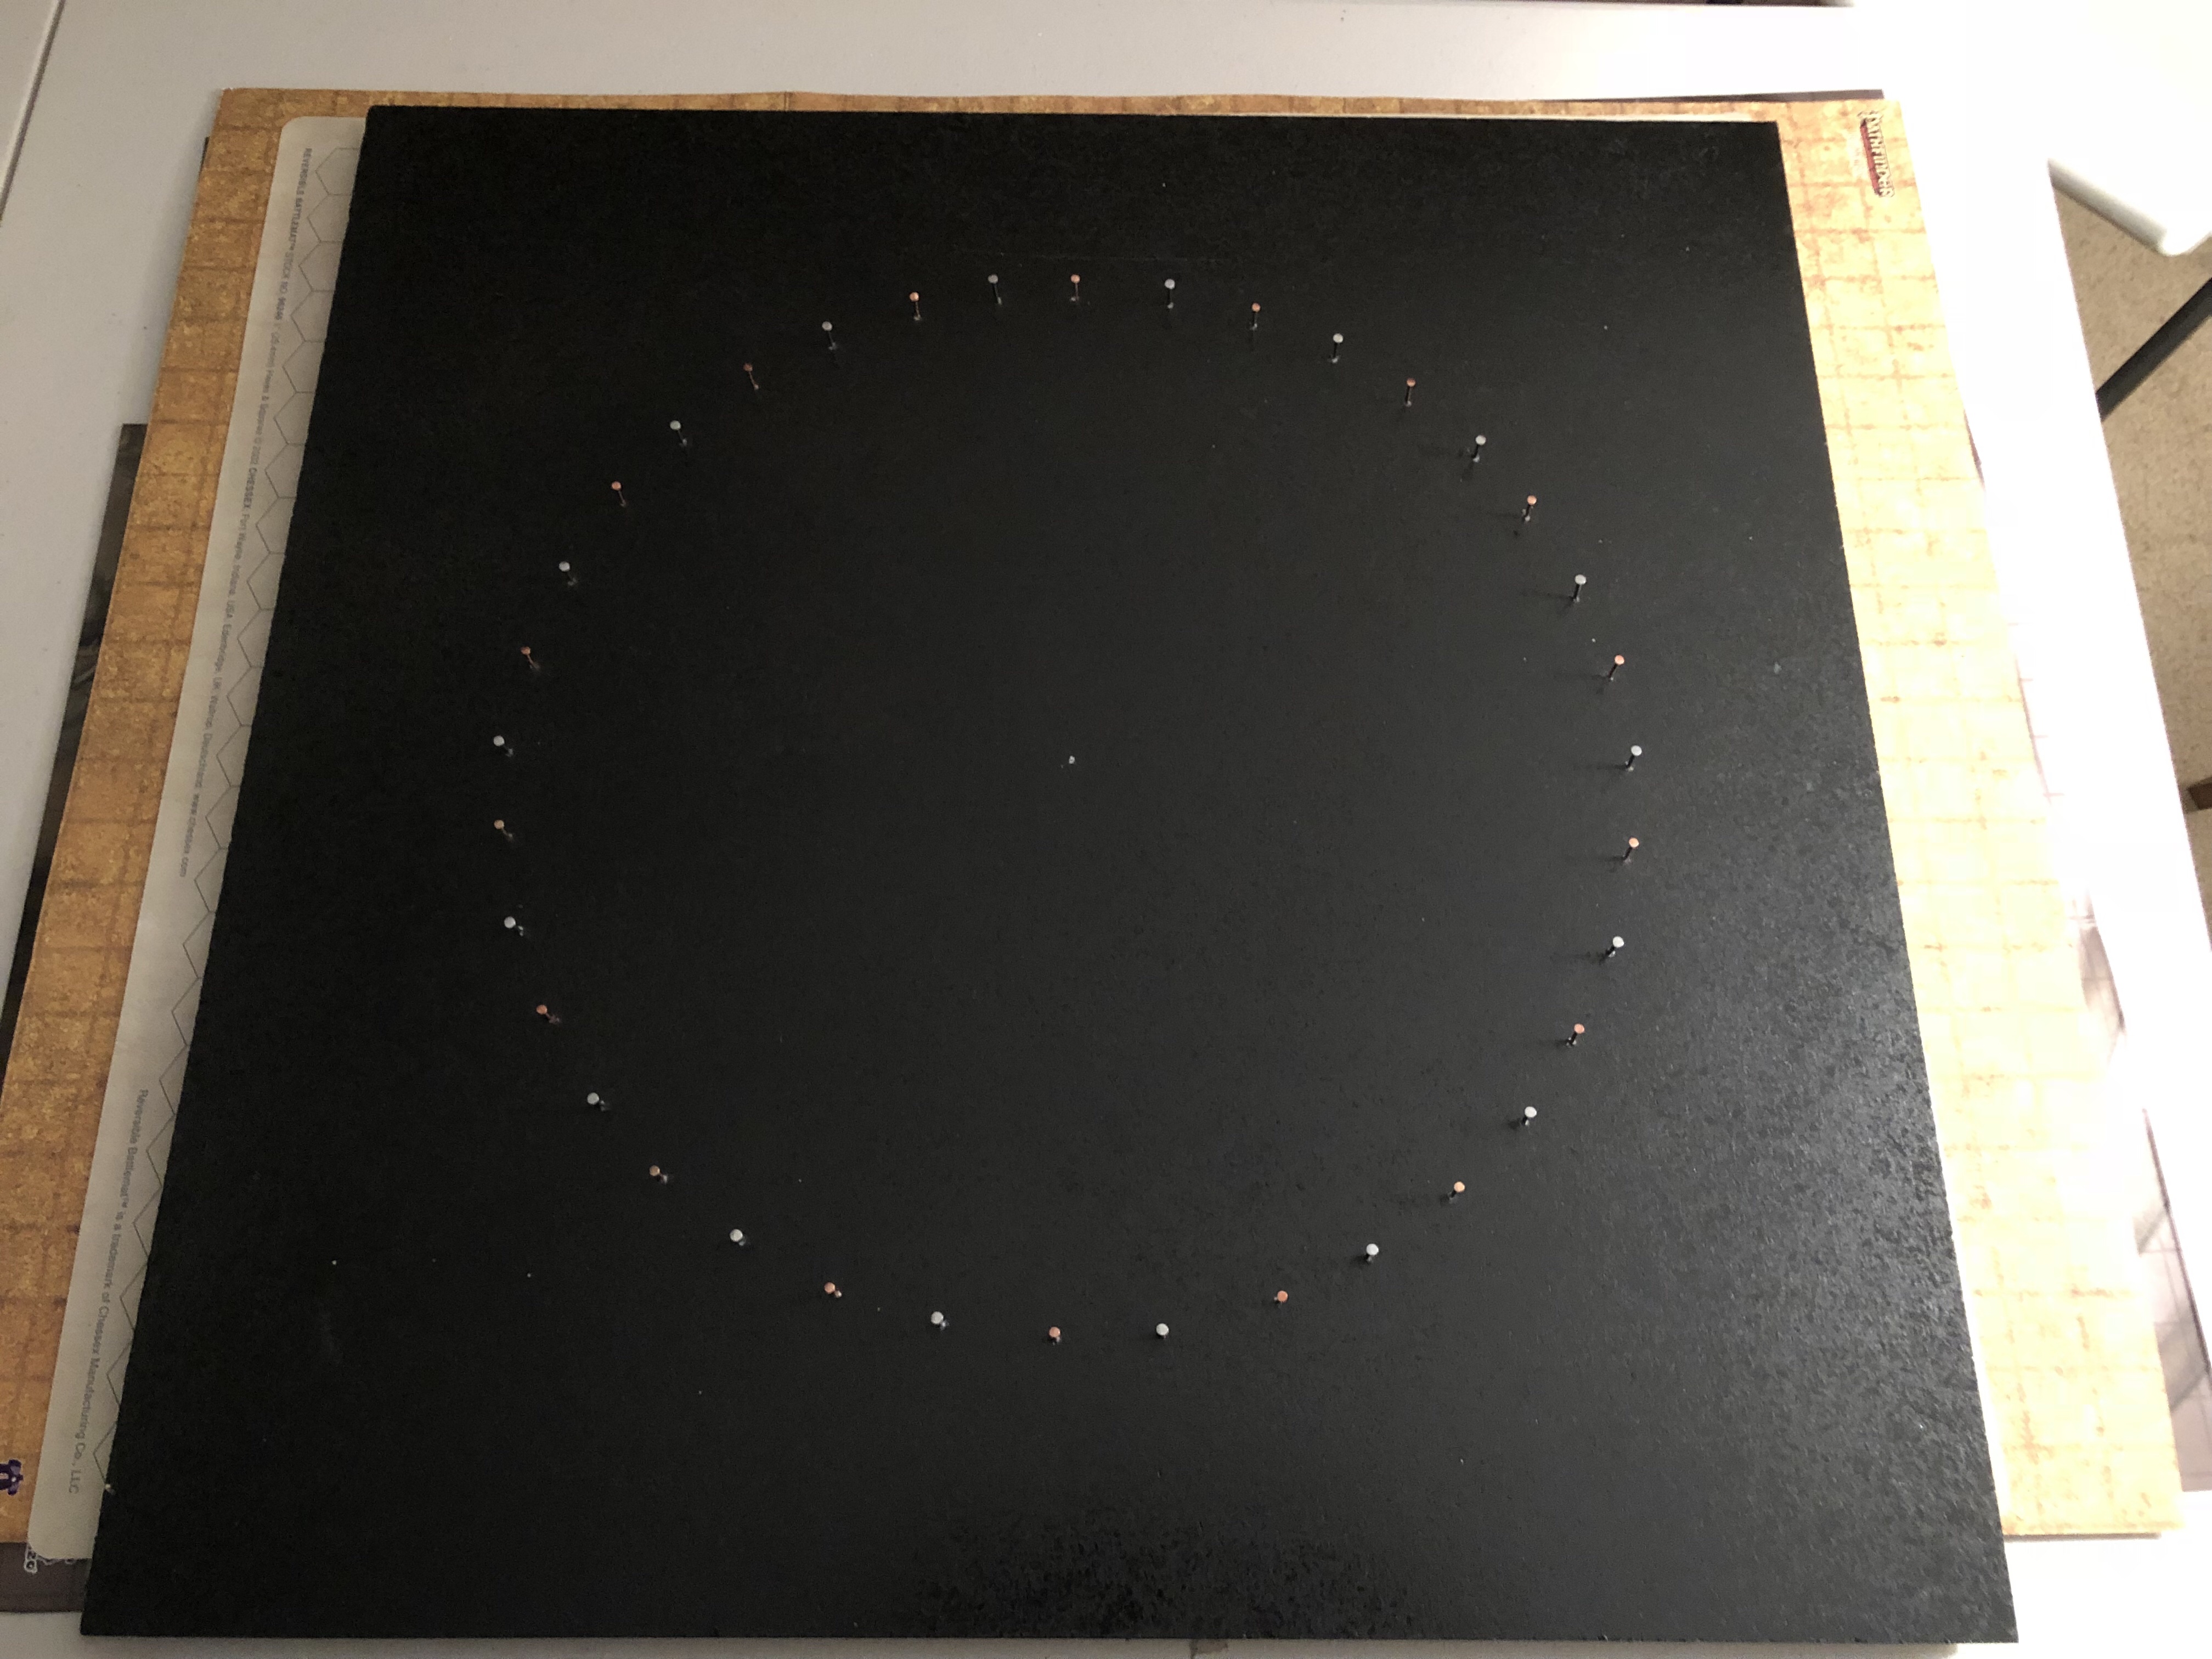
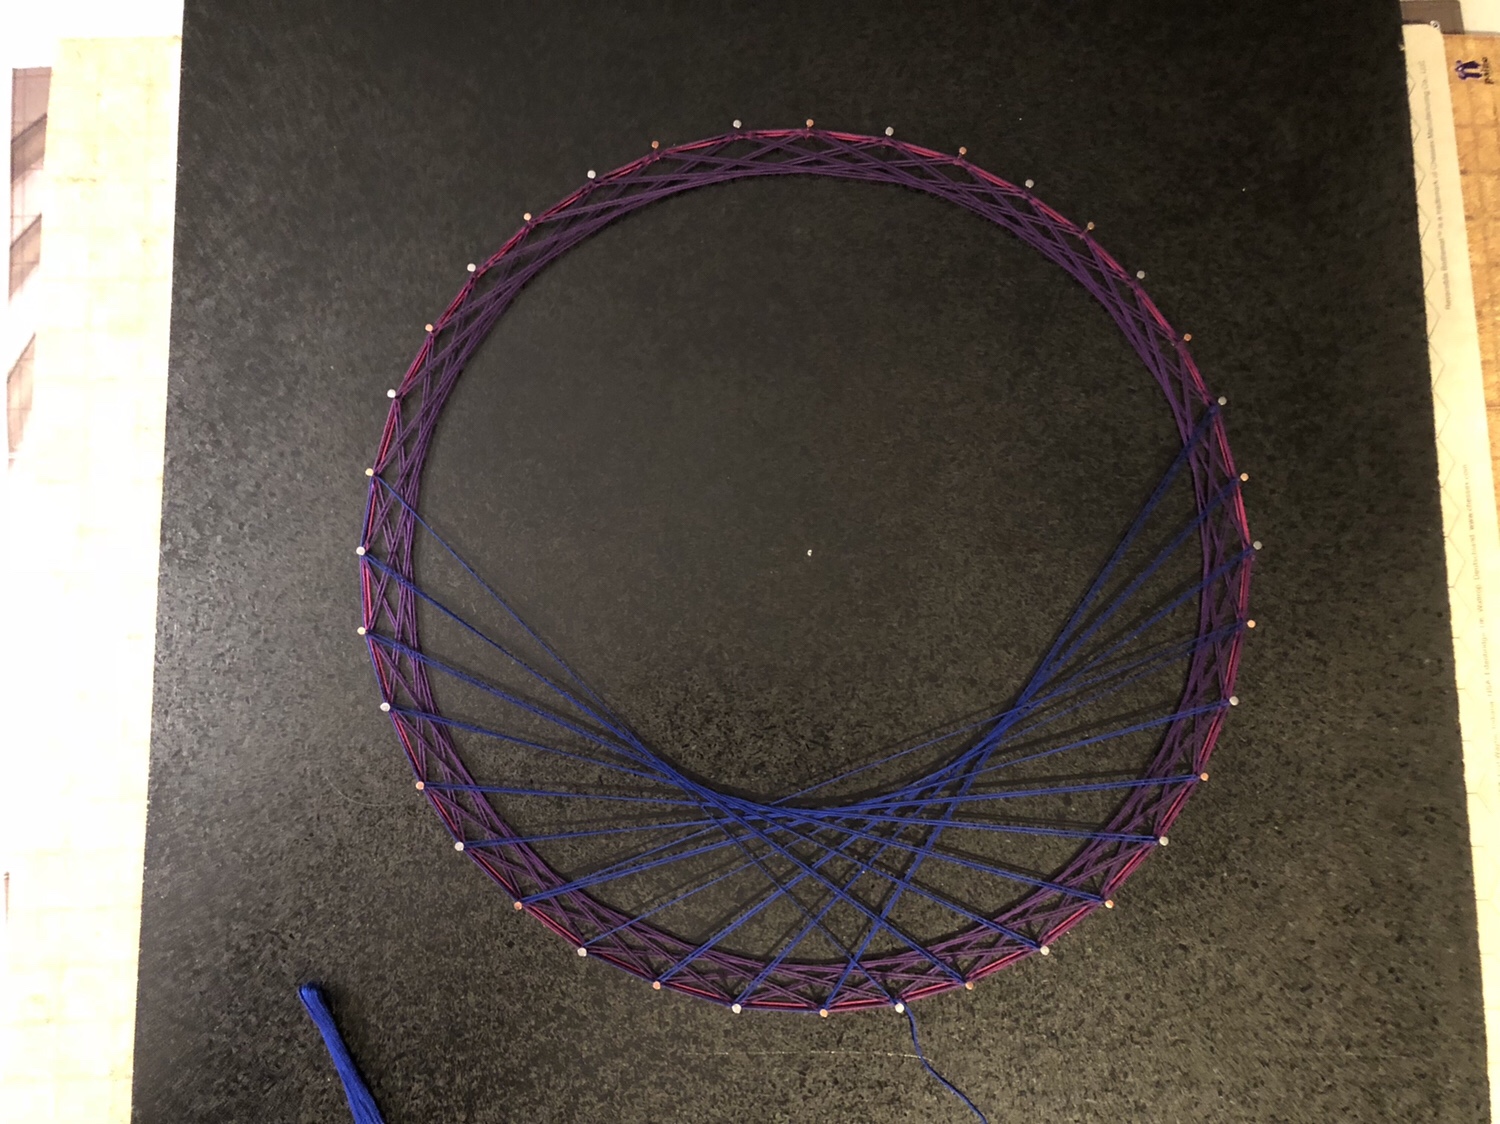
To see the issue clearer, let’s keep in mind that the goal is to create an actual 3D version of the circle using thread for the lines. When constructing a 3D version, the thread gets built from the base upwards. In other words, the thread goes on the loom in the reverse order of the numbers. What happens when higher numbers are covered over with thread as the lower numbers get added?
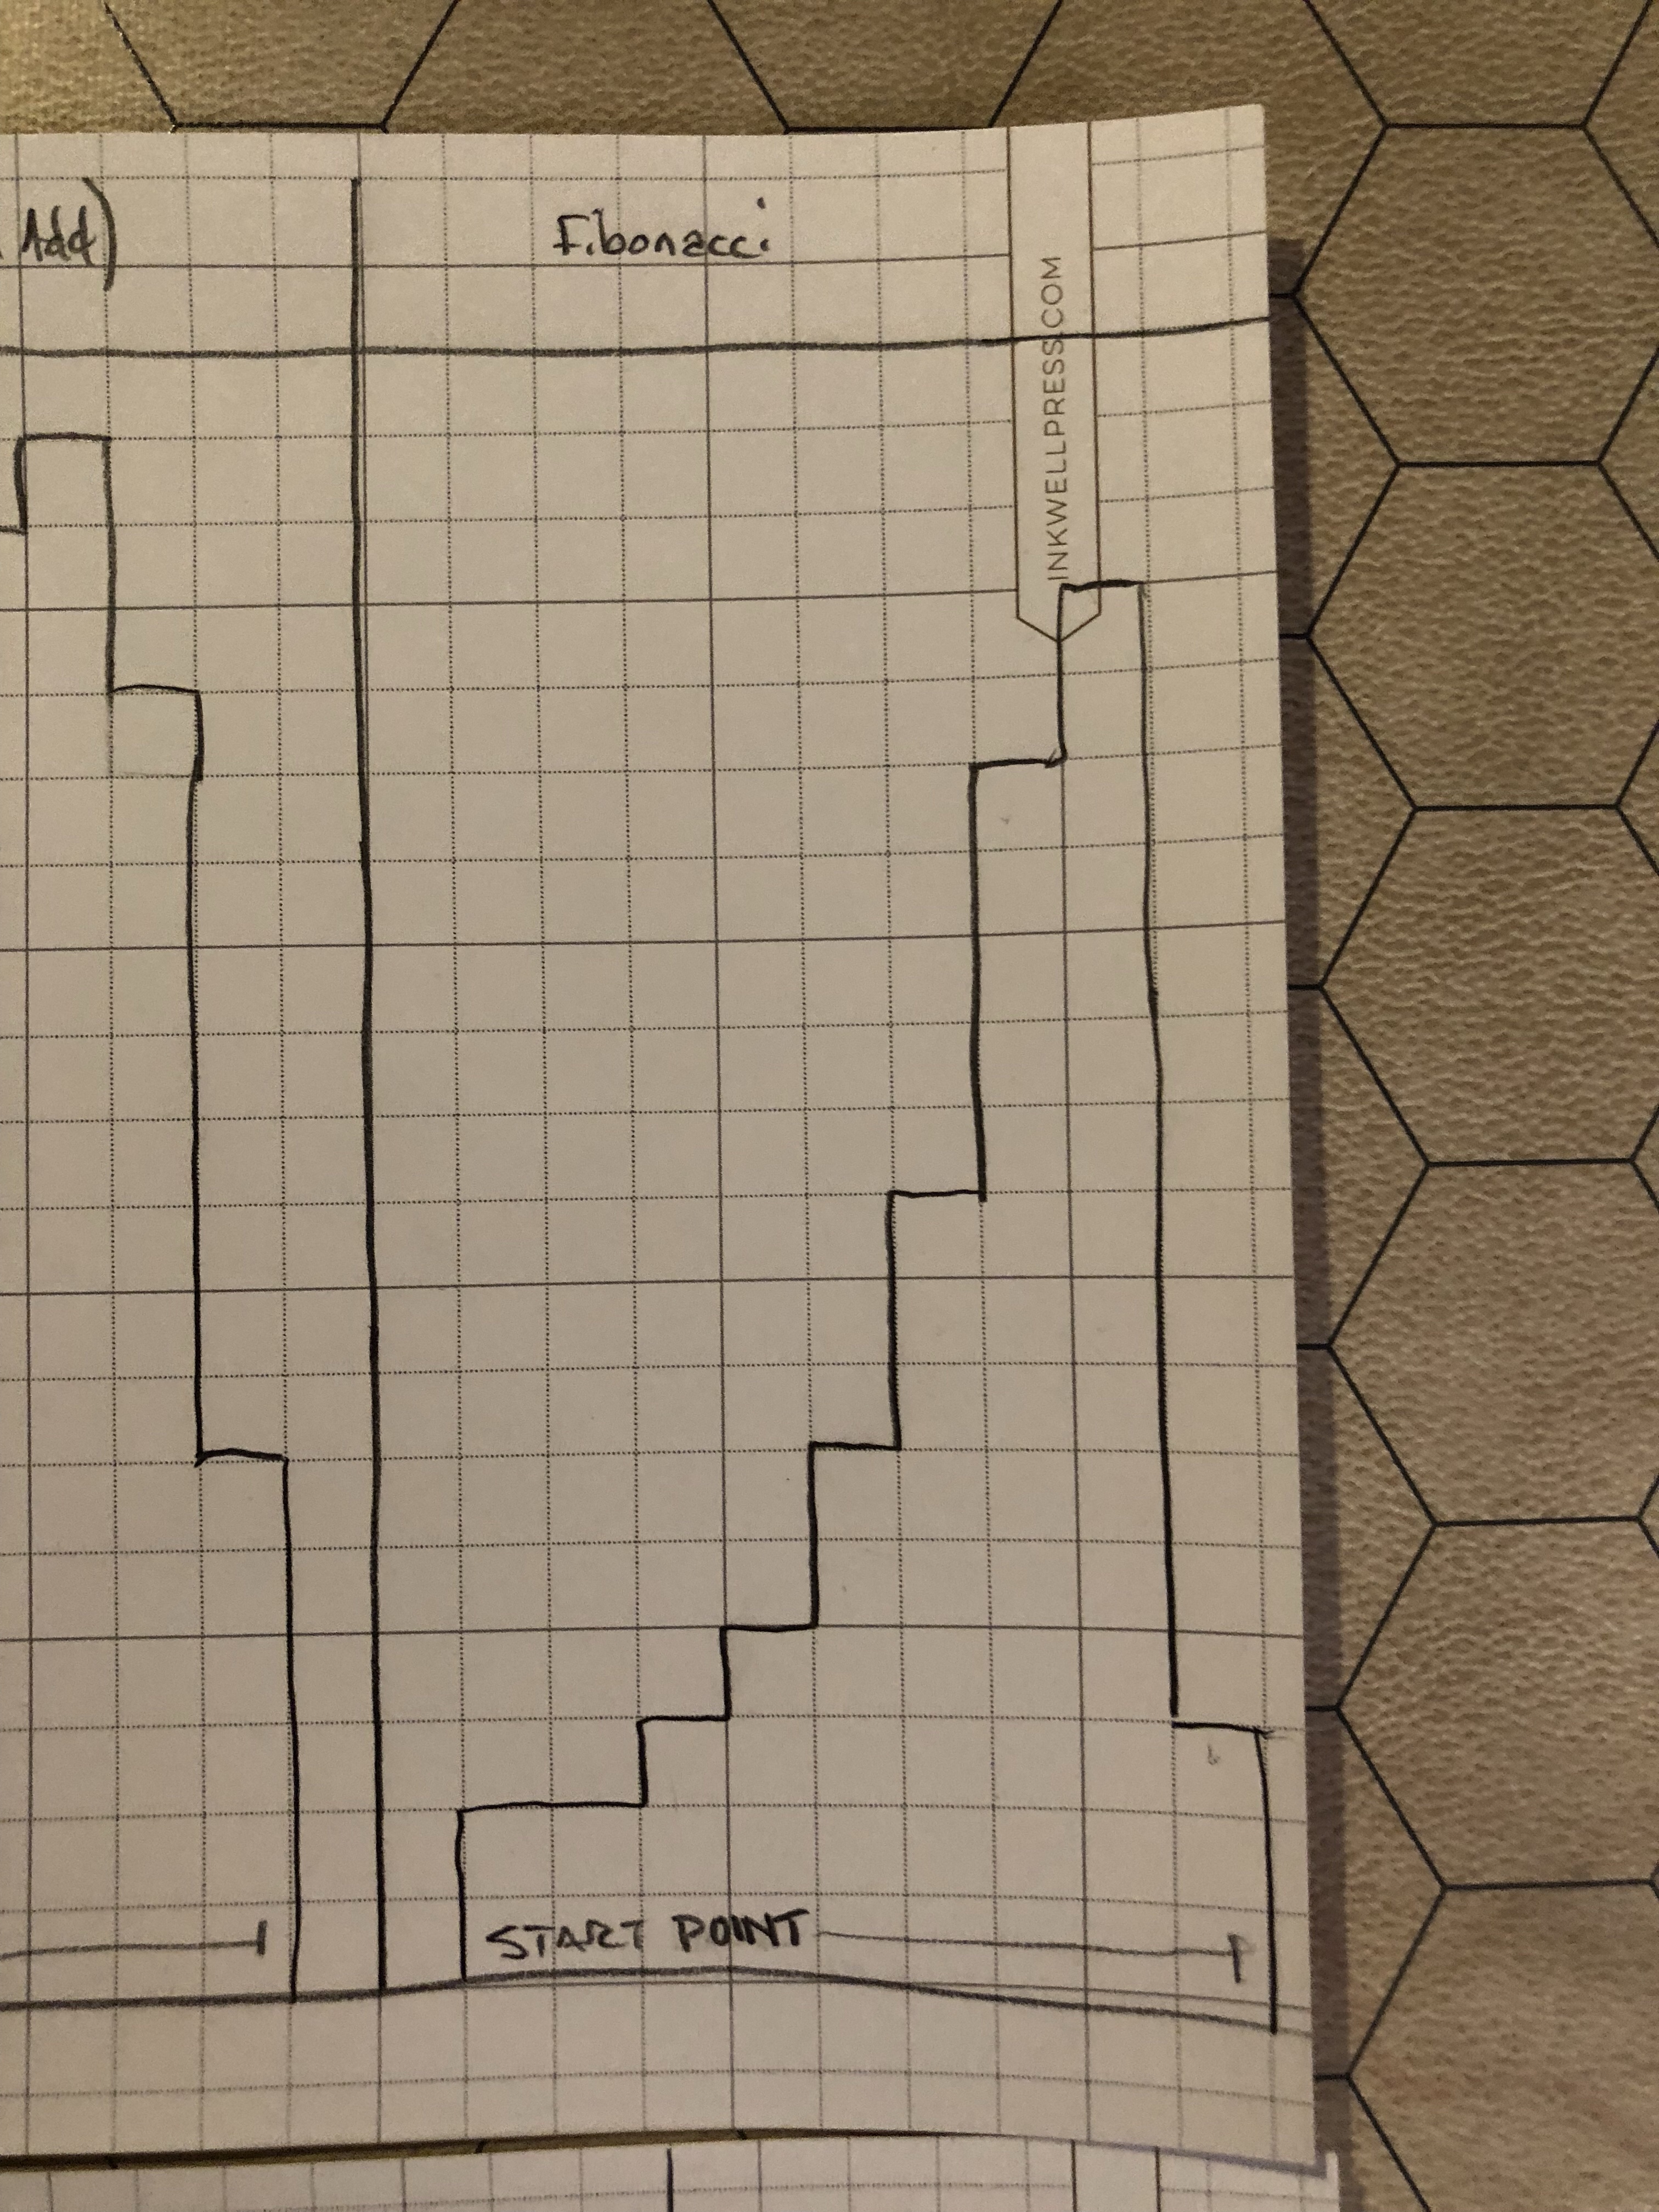
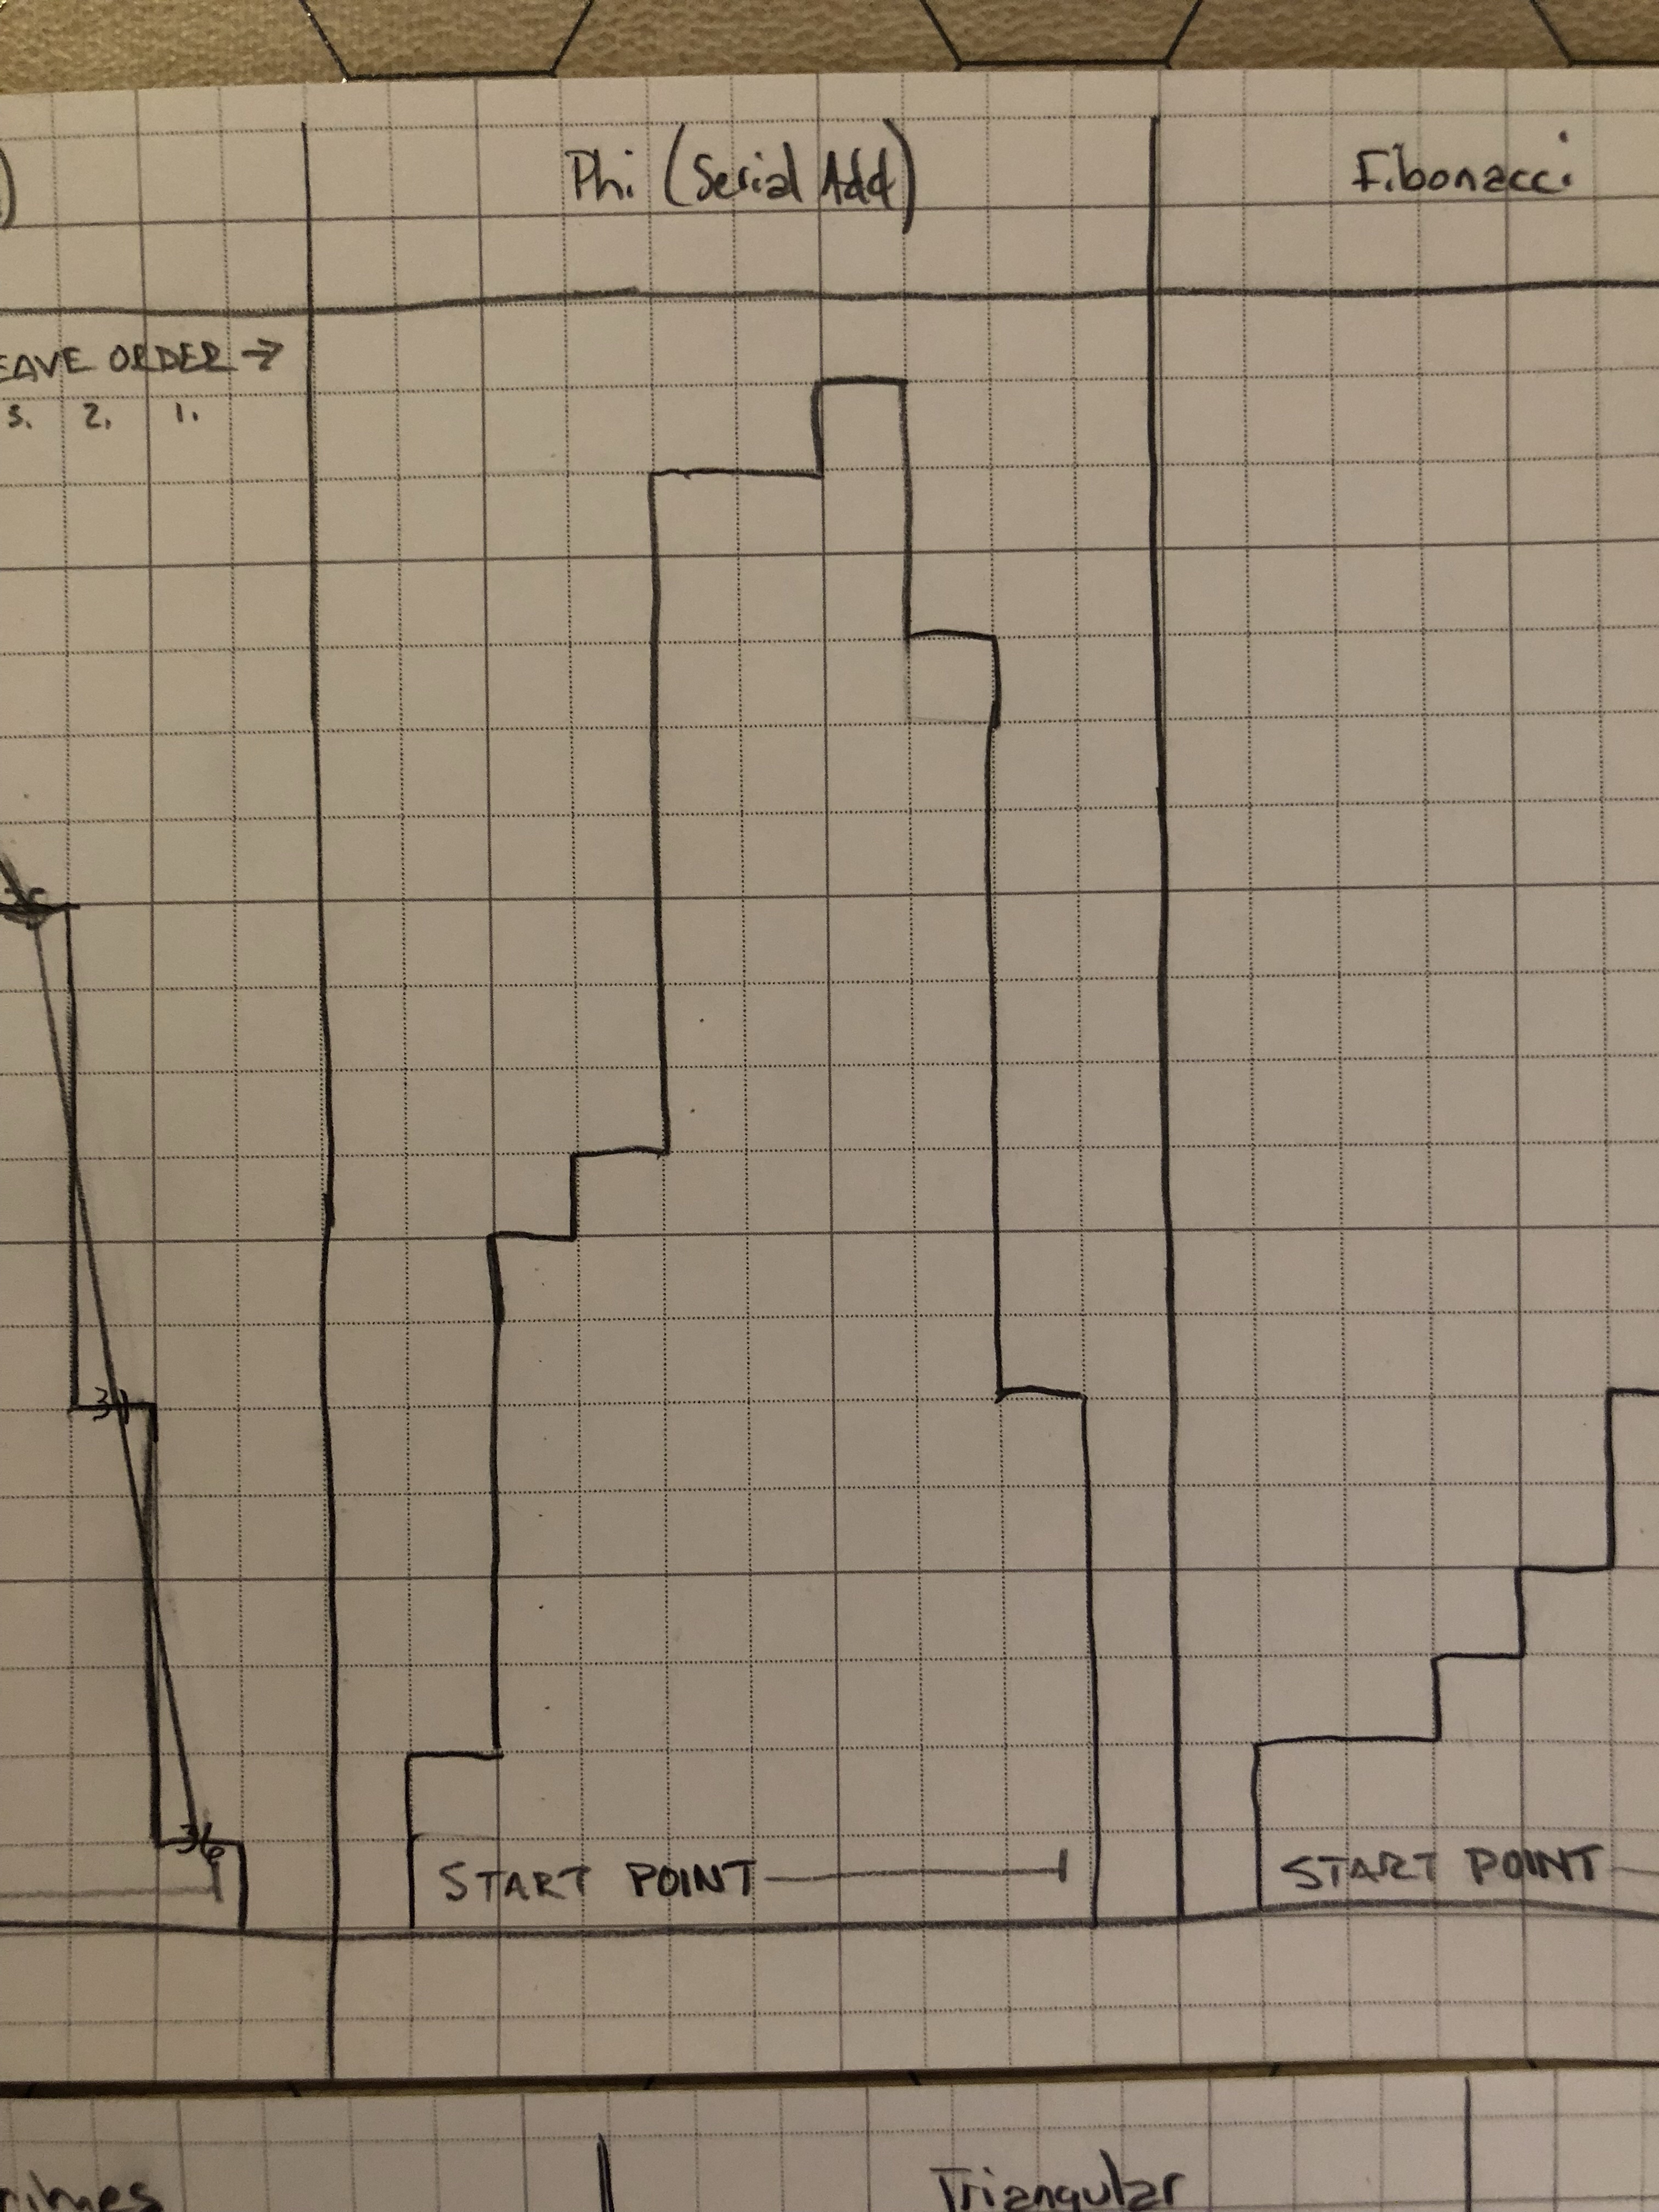
To see the problem clearer, let’s view several sequences in cross-sectional views.
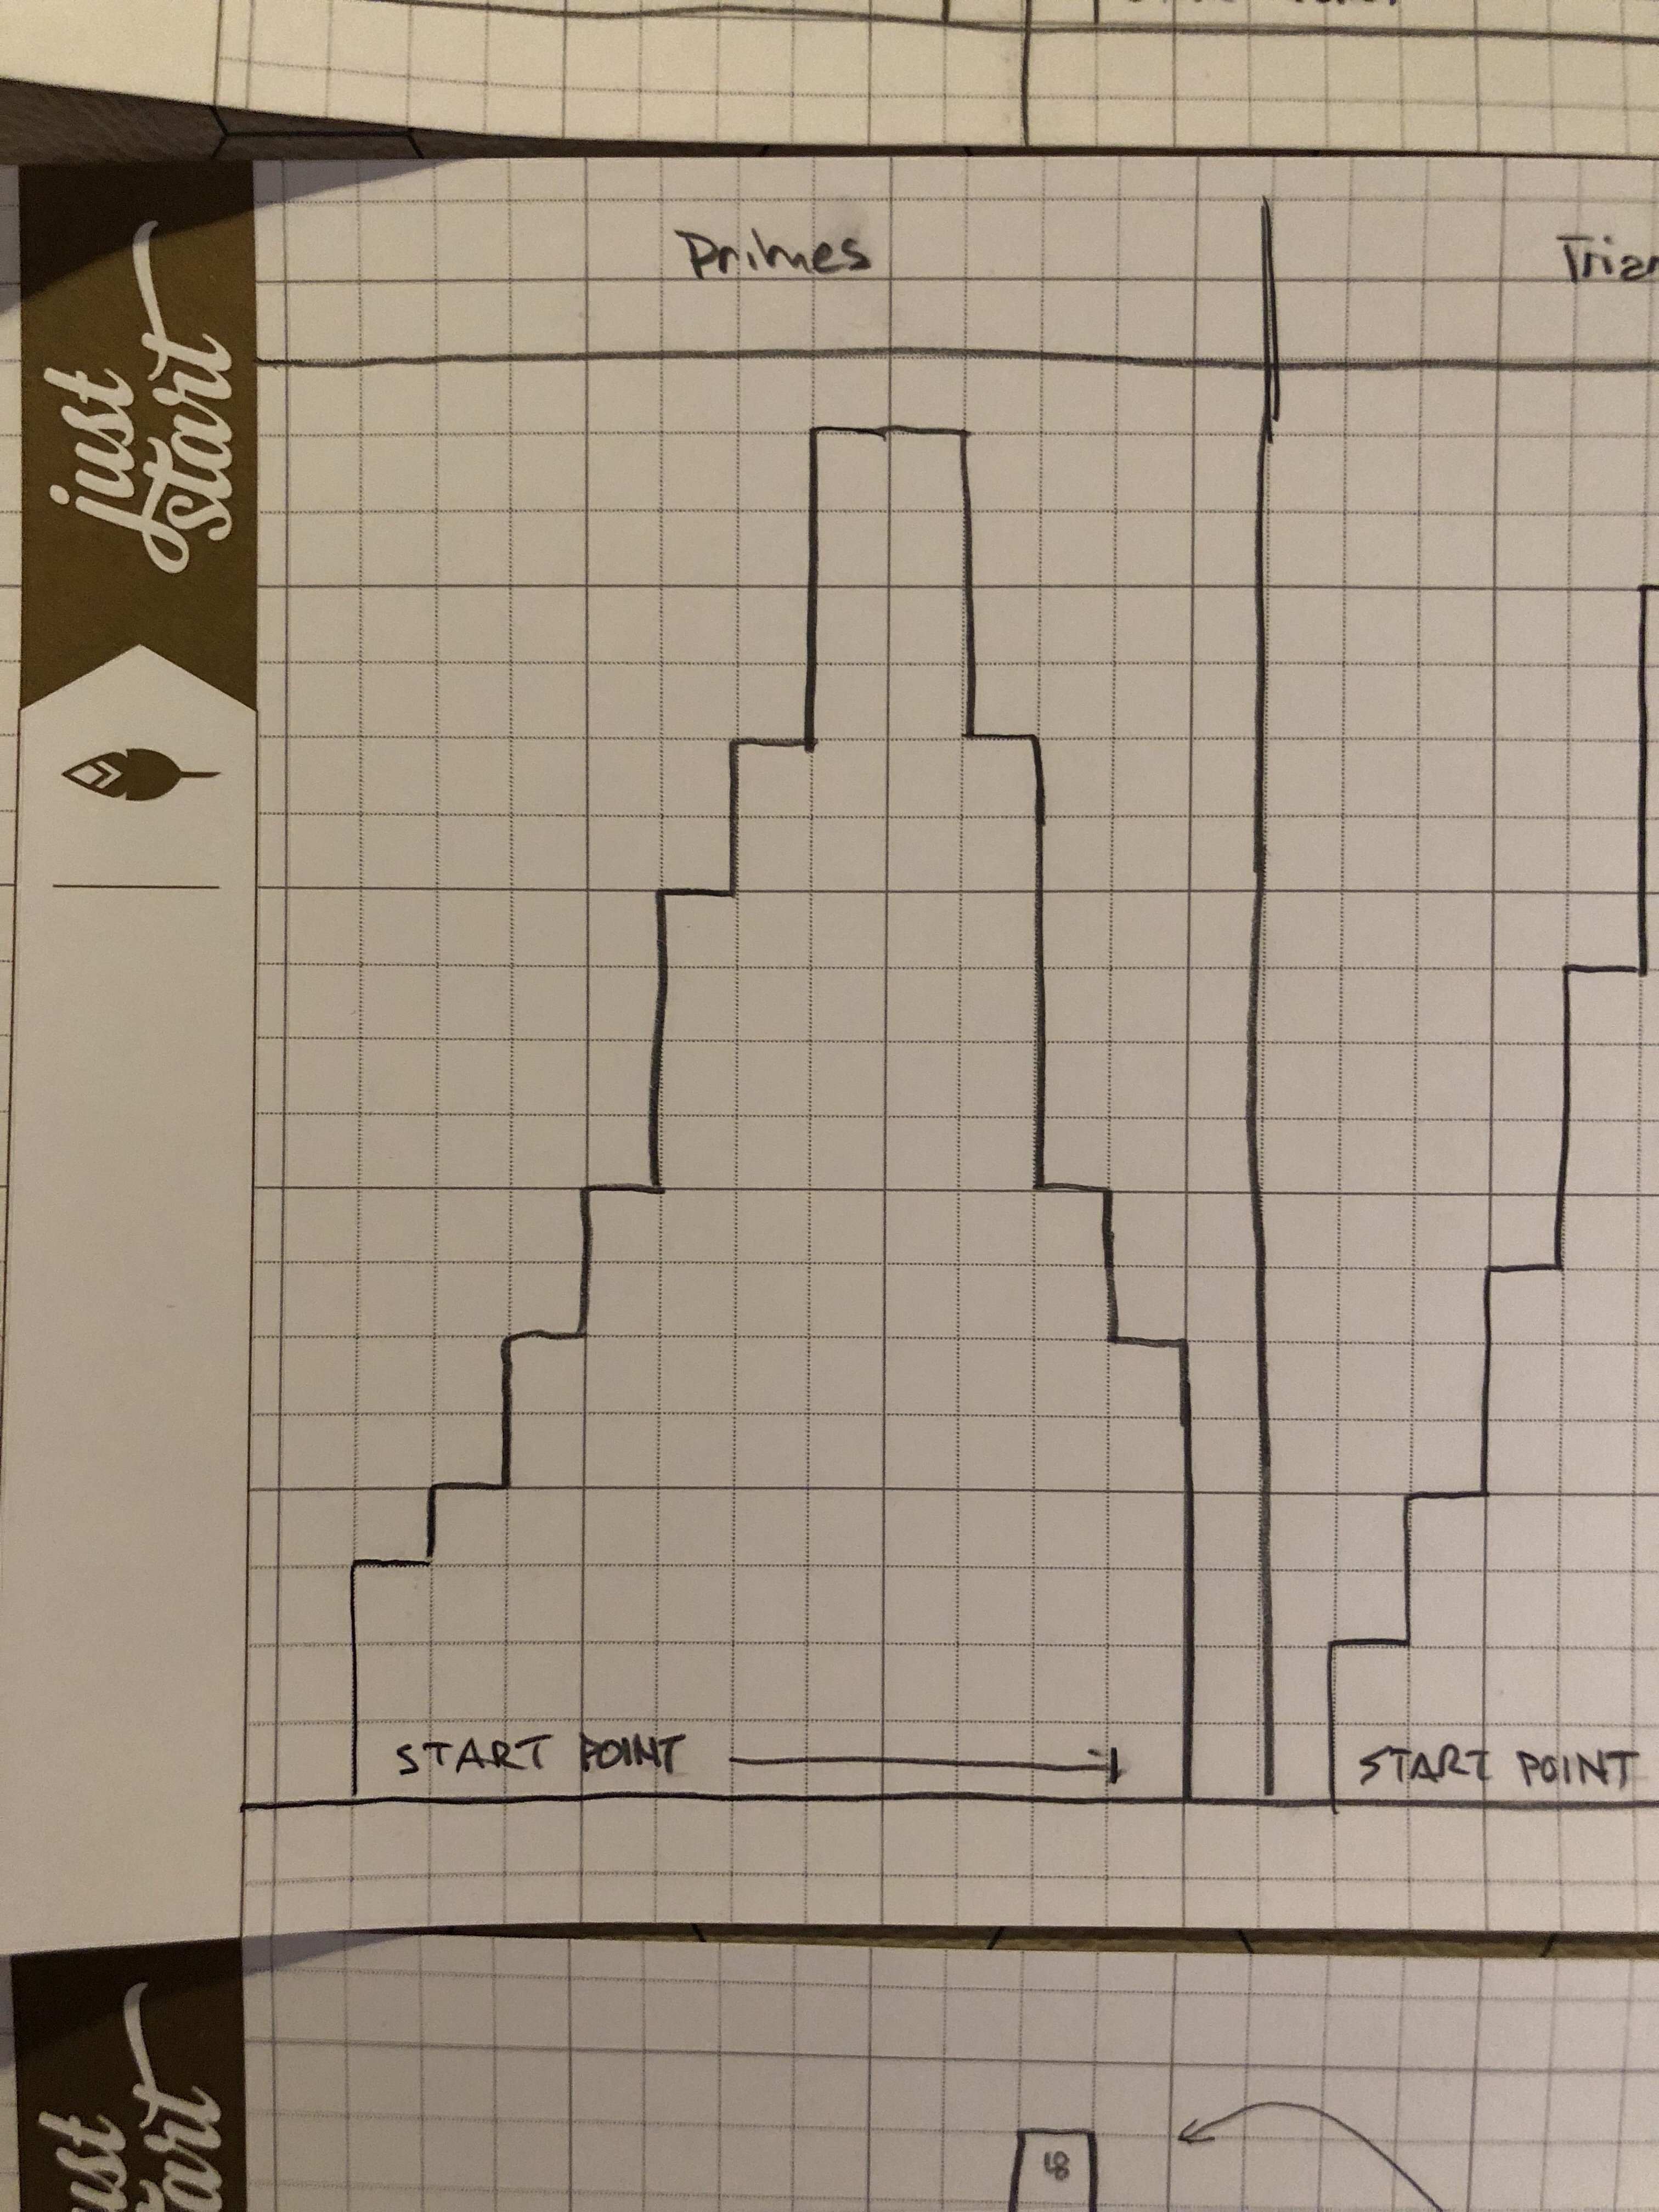
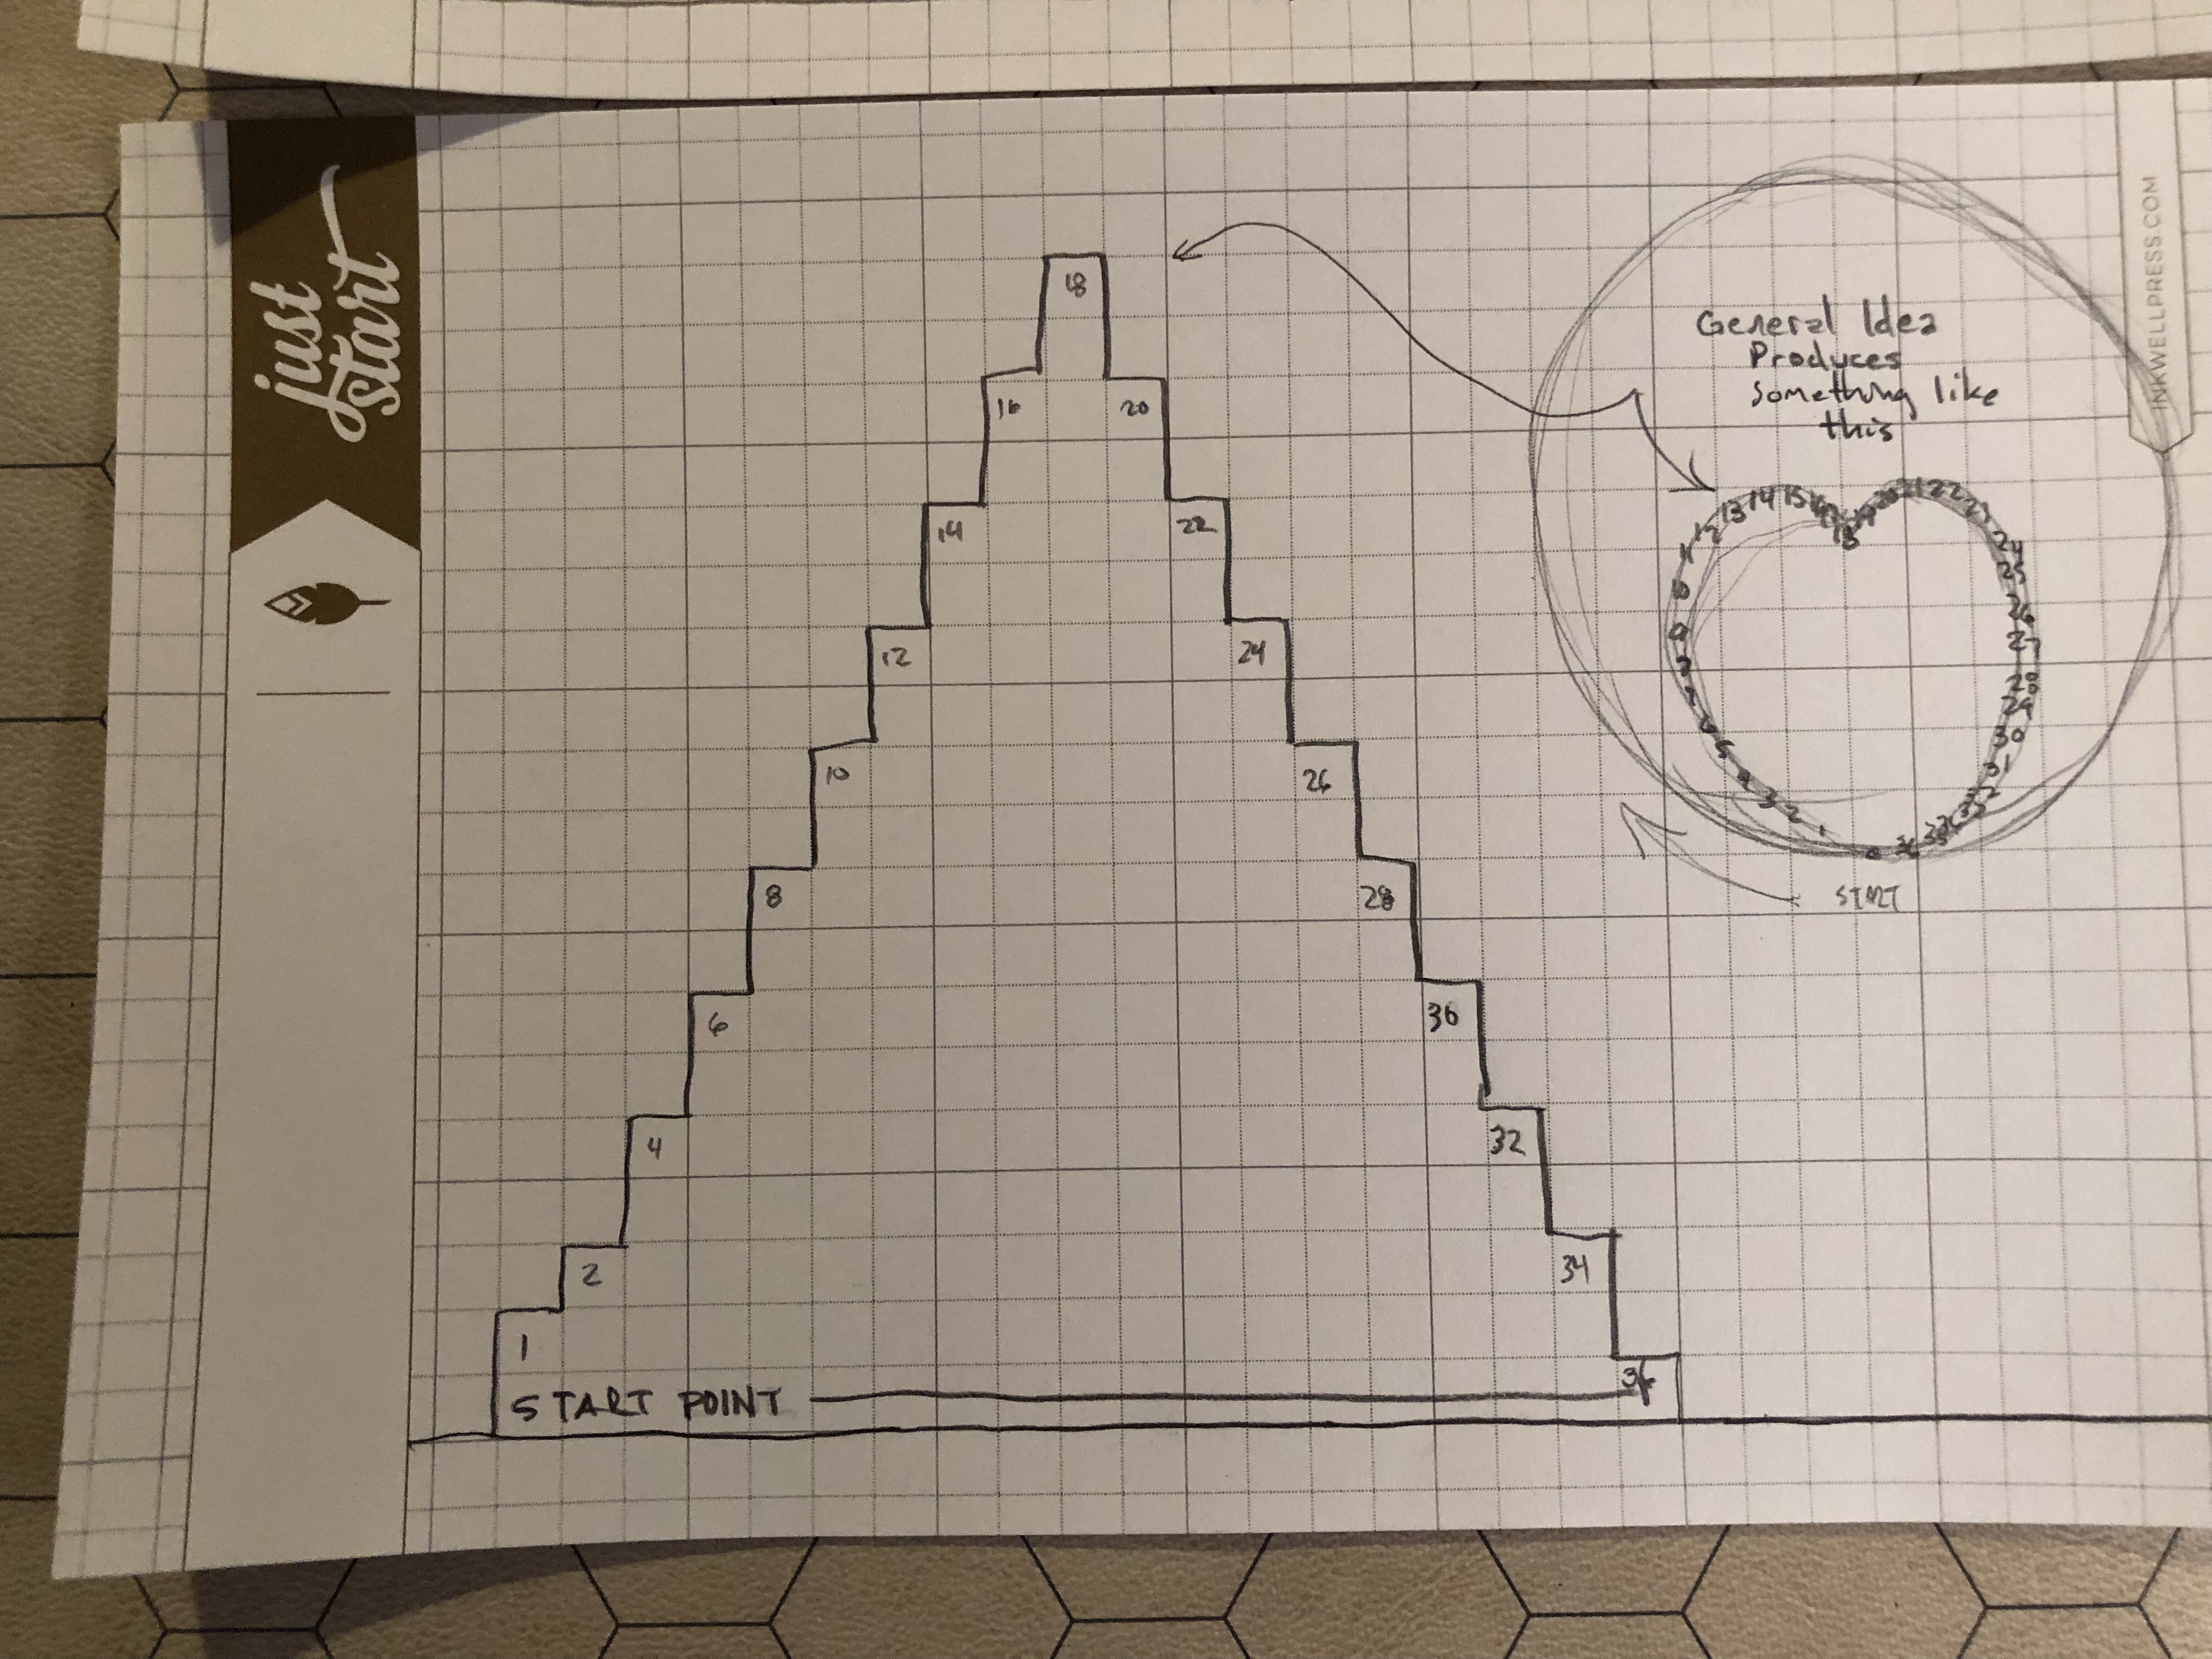
Interestingly enough, from doing this, we see that the Pi Sequence is actually a great sequence to apply to the 36-degree circle. The Prime Sequence turns out to be a bad choice, at least with 36 degrees. The “odd” nature of Prime Sequence causes several numbers to coincide with their corollary, which would hide the higher number and/or artificially reinforce the lower numbers (e.g 5 & 31, 7 & 29, 13 & 23, 17 & 19).
This doesn’t happen with the Cardioid because the even numbers are only “counted” one instance whereas using our method, each number is “counted” 36 times to form the full circle.
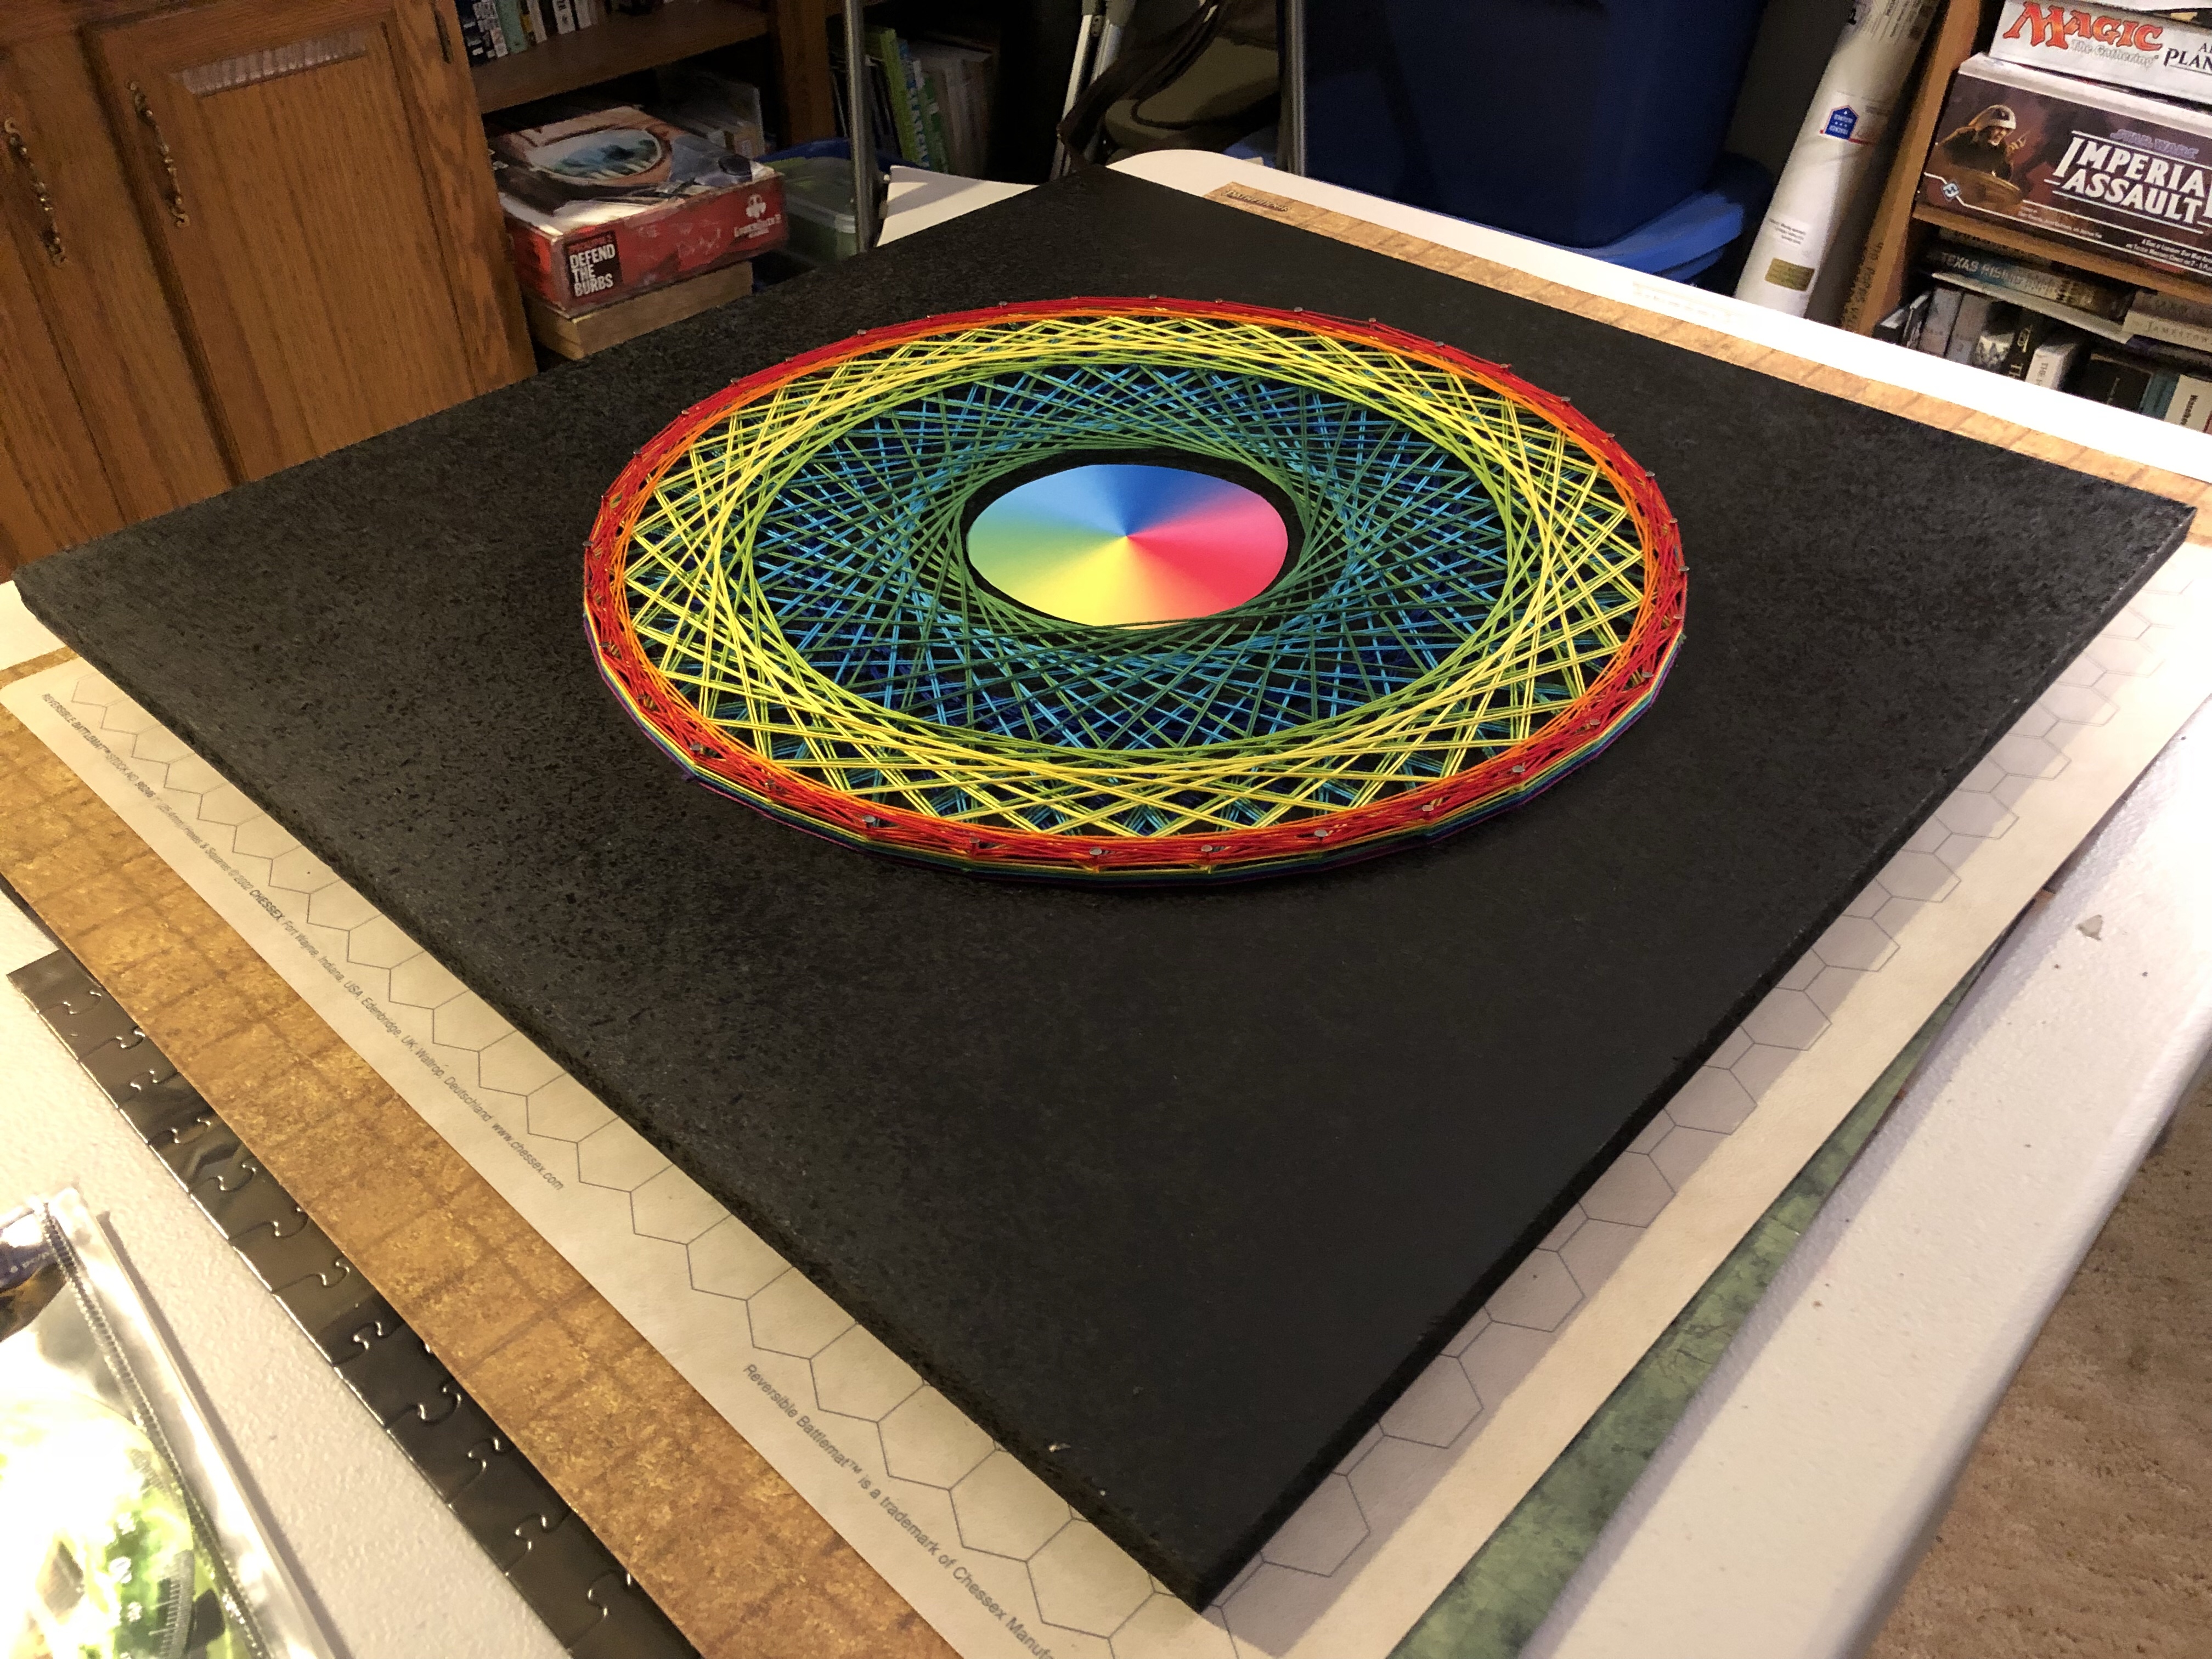
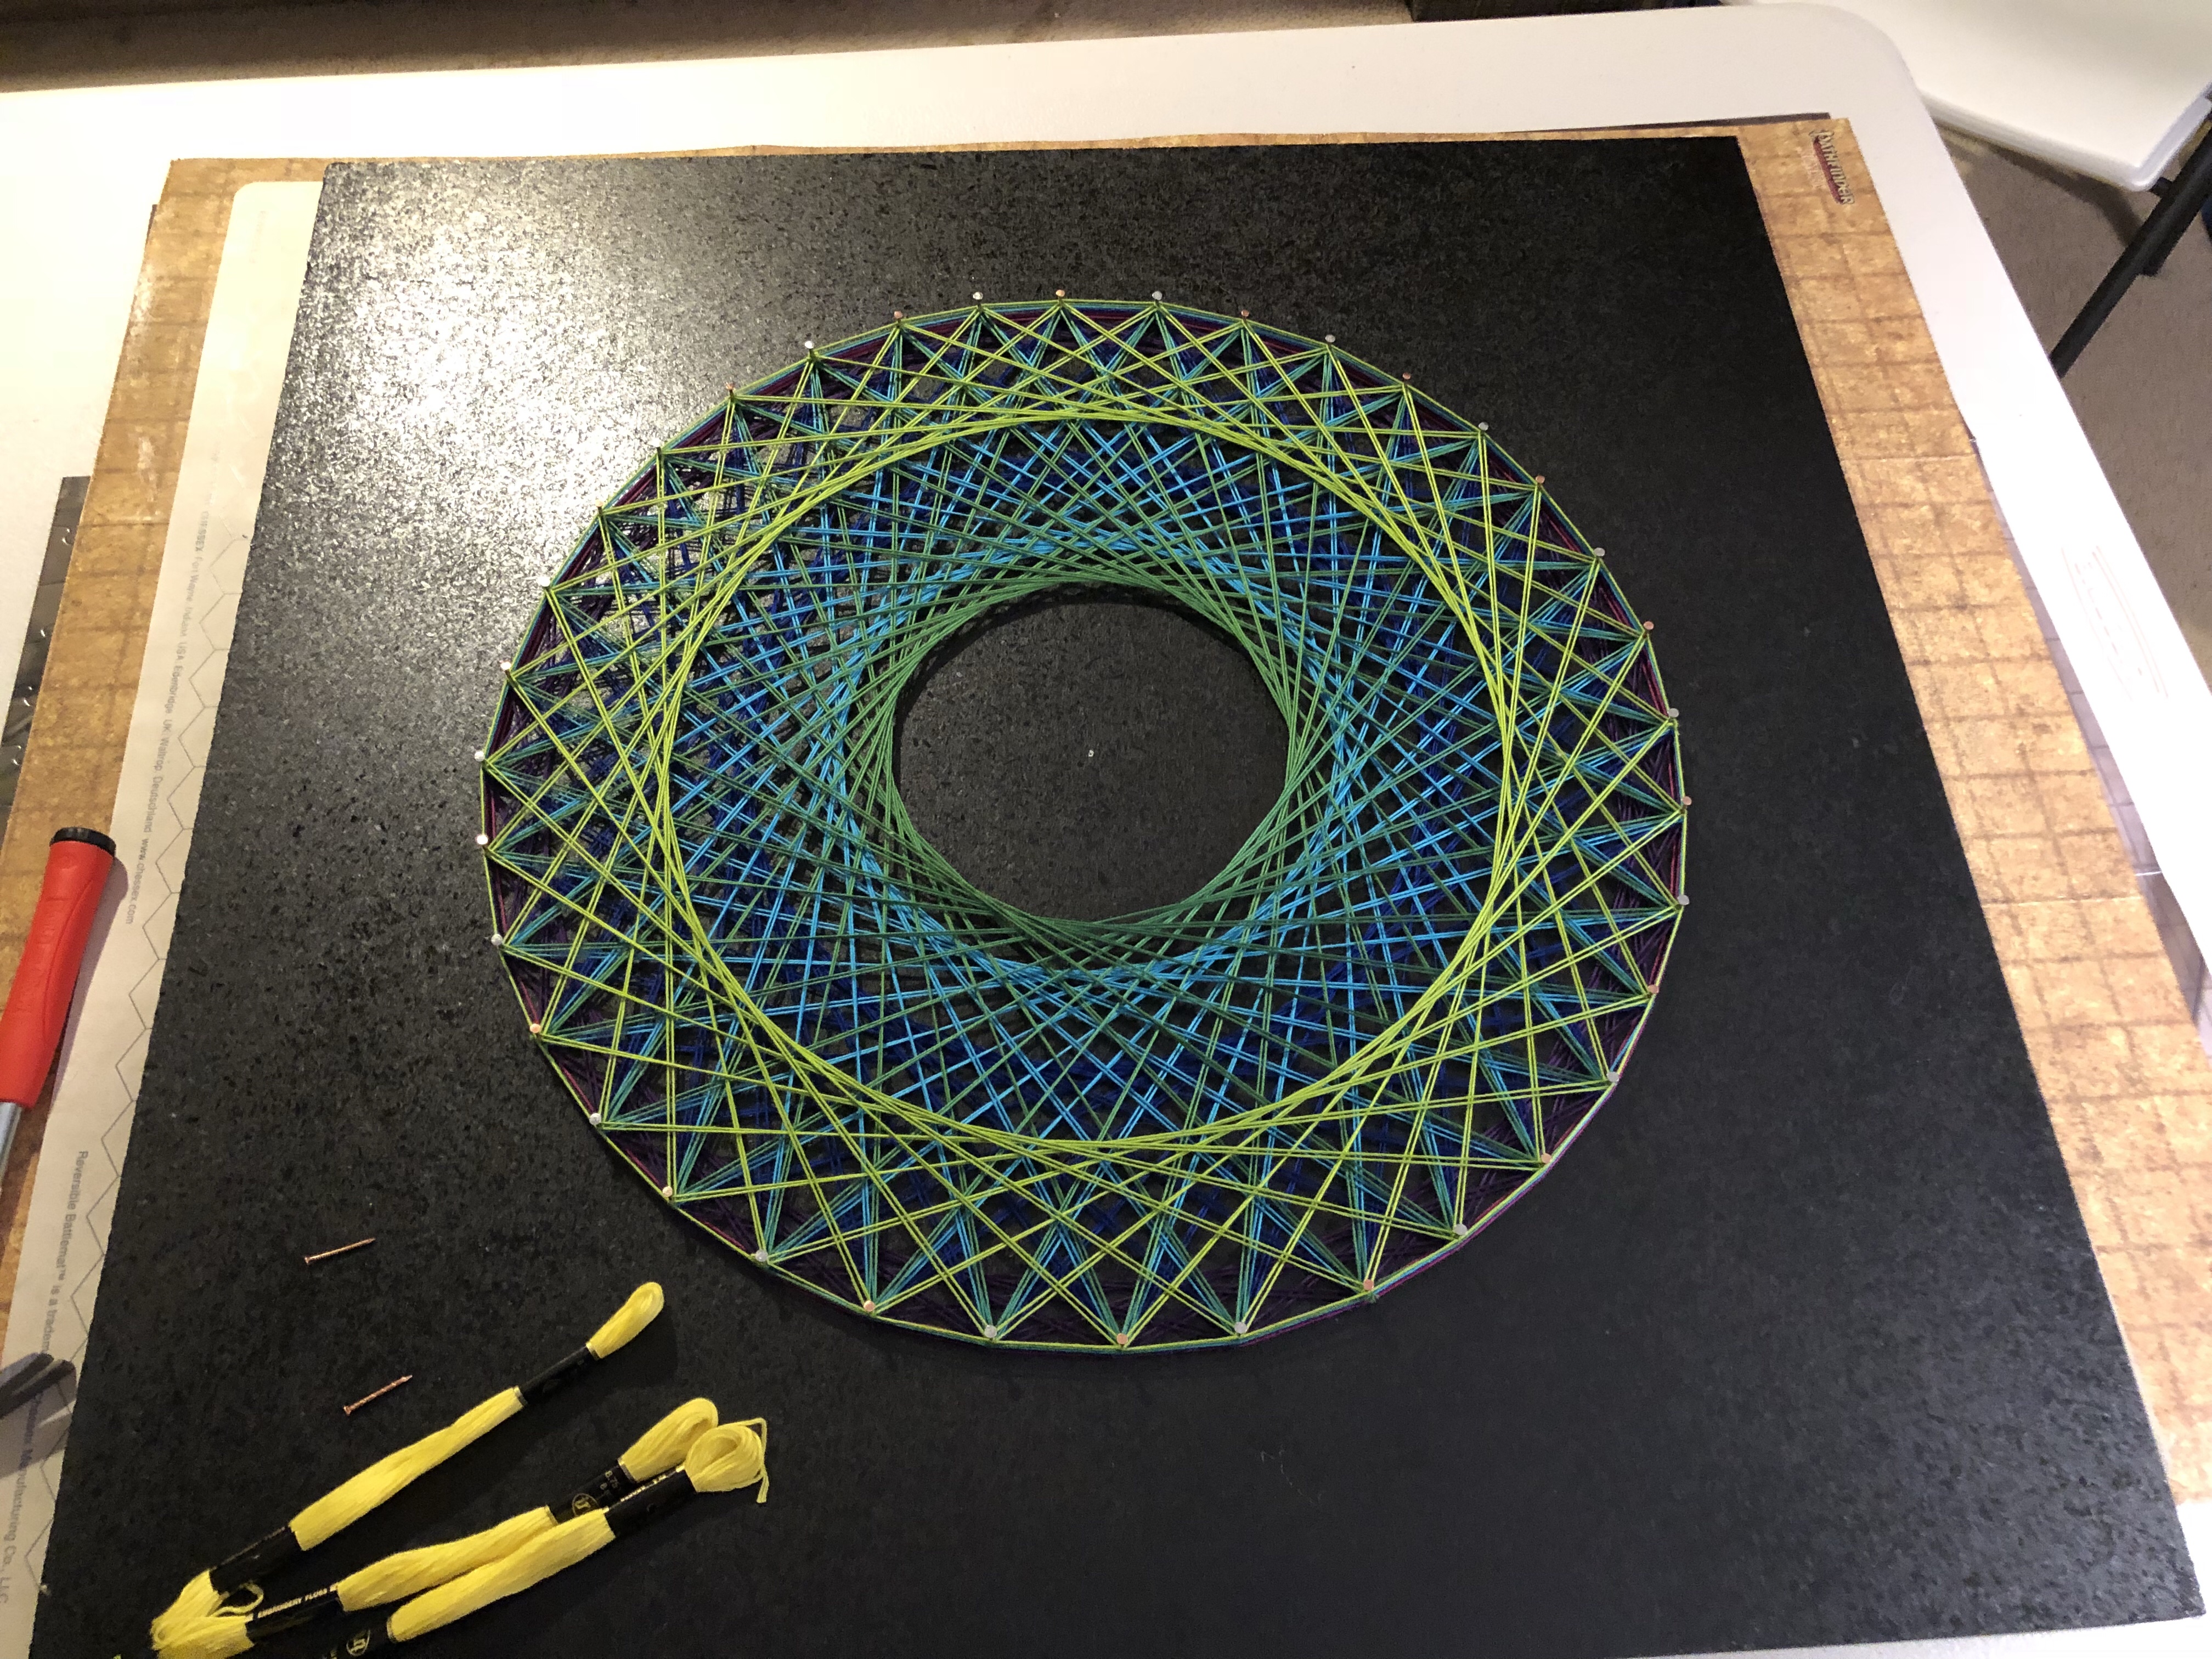
An artistic method of differentiating the lower and higher corollaries is to map each number to a color. I chose to use the RBG color wheel because it is already mapped onto a circle. Plus, the values are precisely determined – even though I chose not to seek out thread colors of such exacting values.
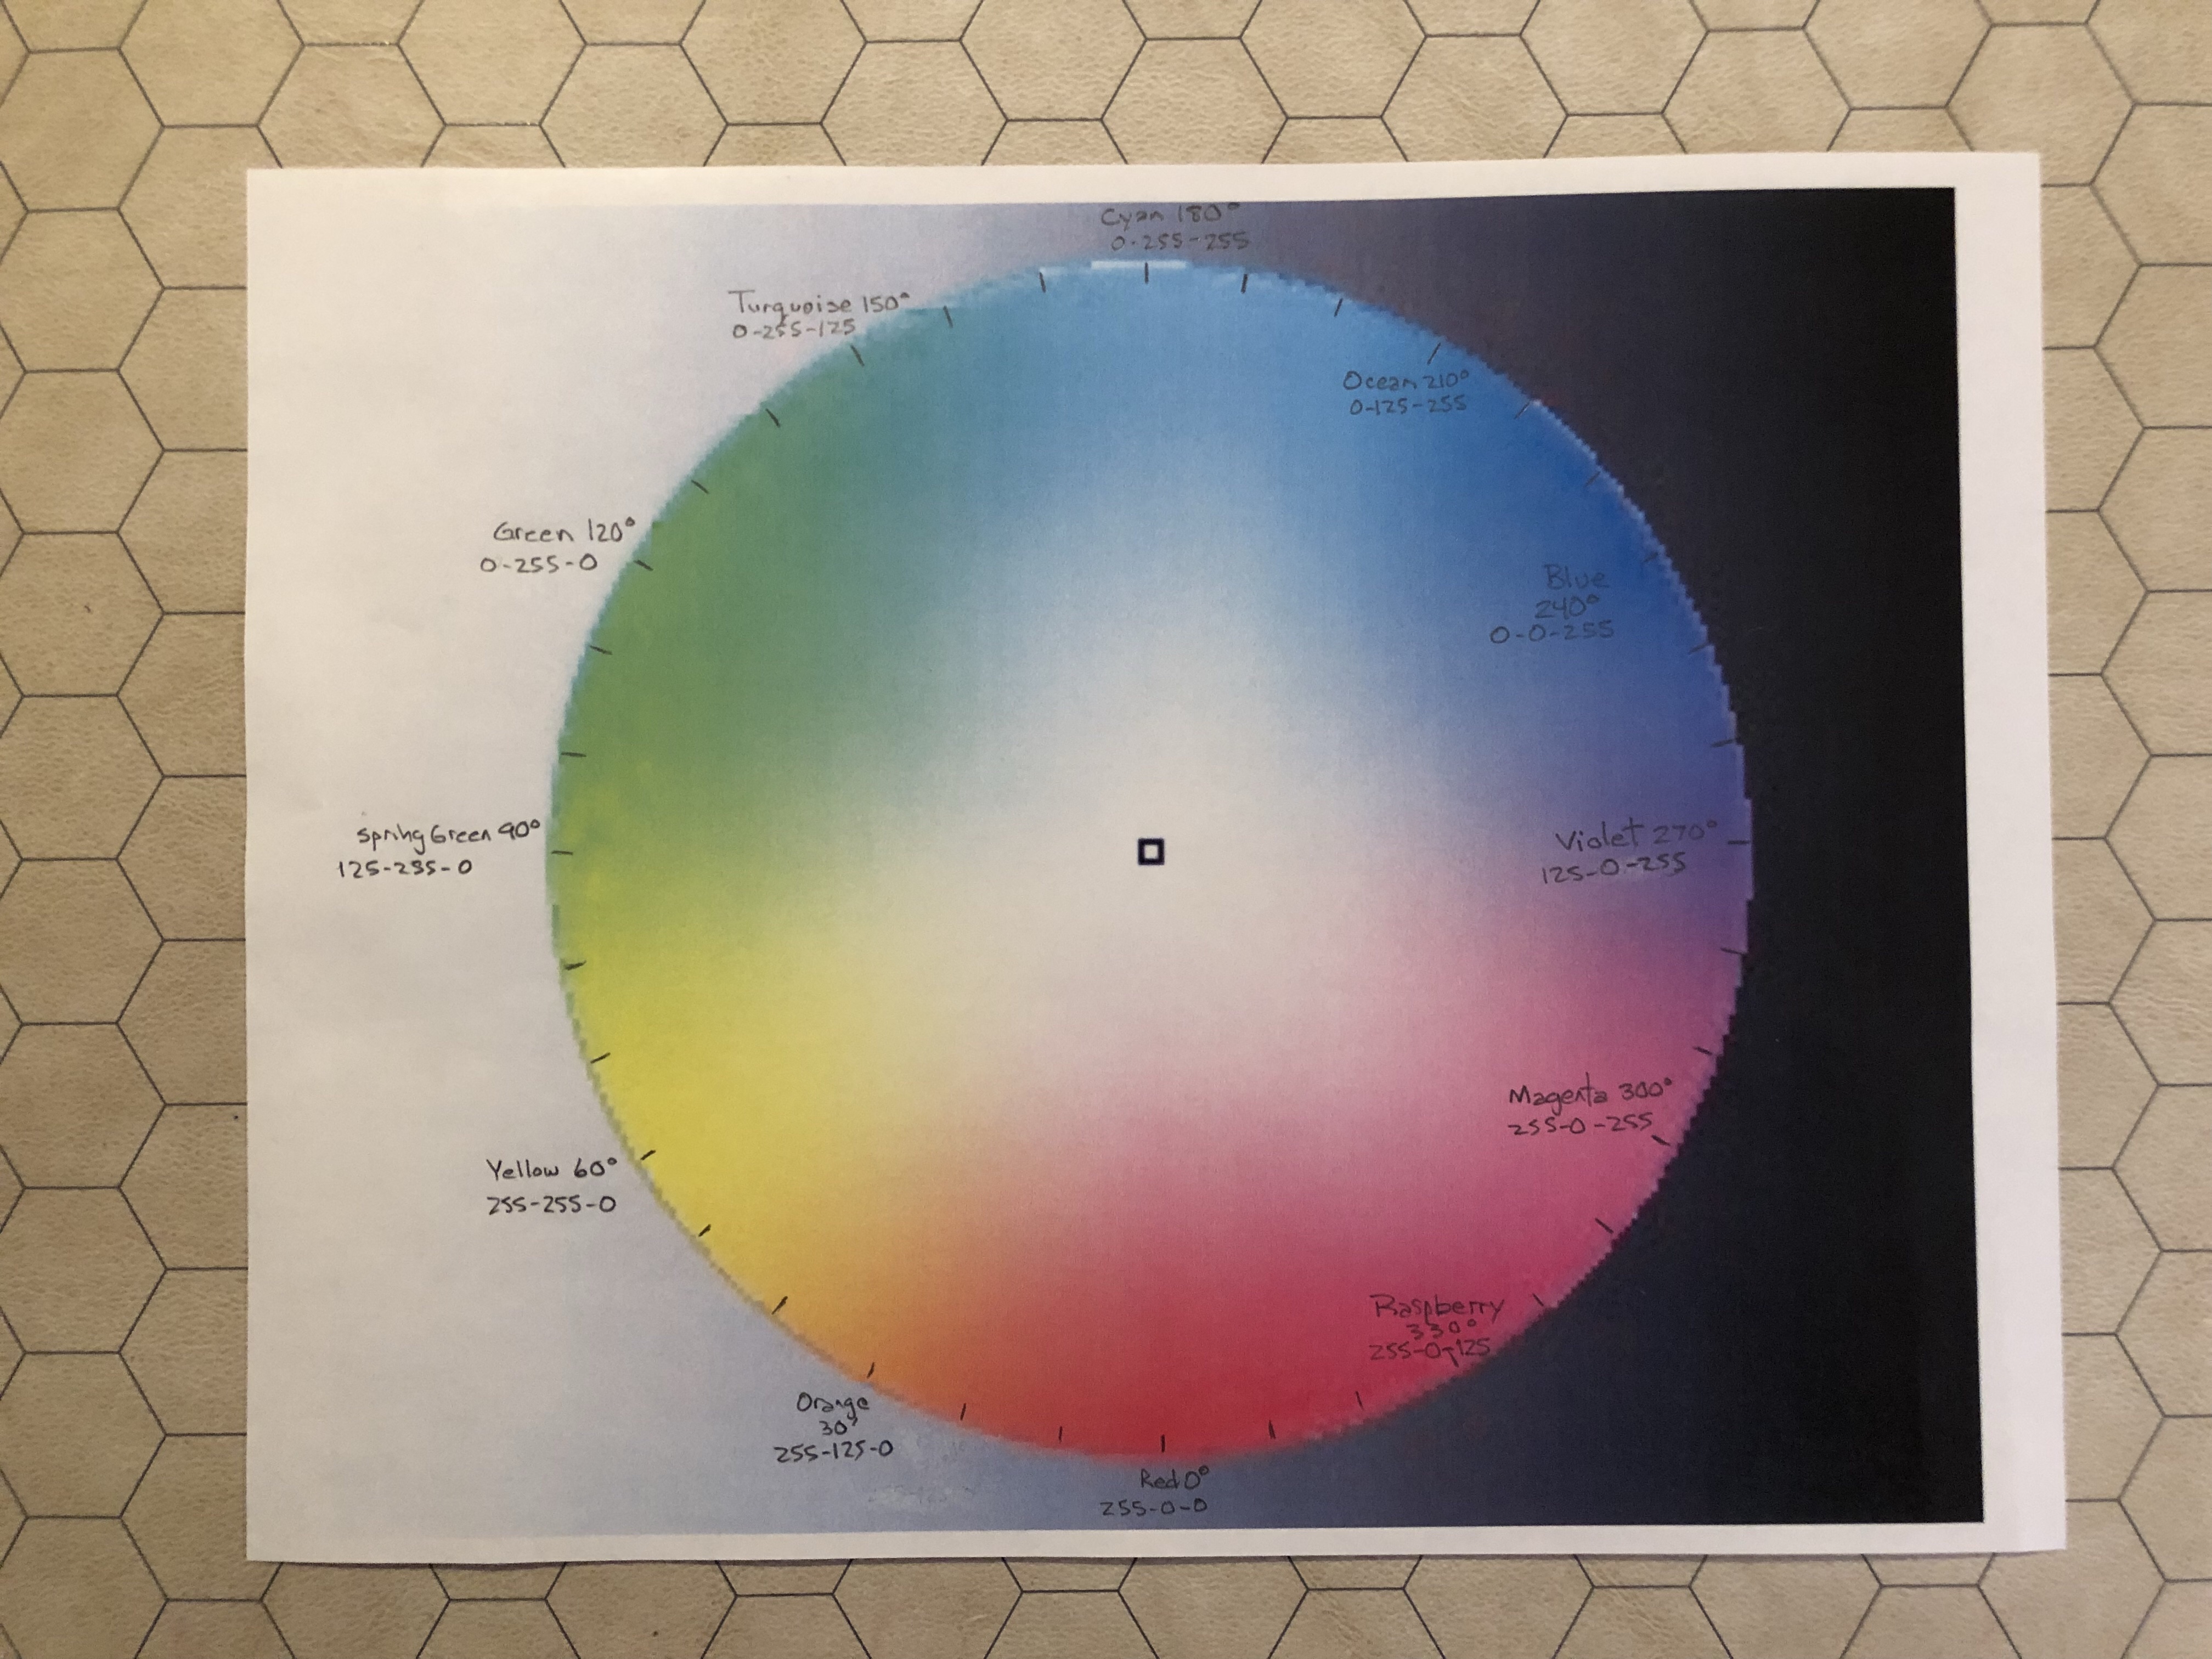
By adding color values to the circle we can see quite easily the difference between a “yellow 6-valued circle” and a “magenta 30-valued circle”.
The end result is like looking through a rainbow of the digits of the Pi Sequence.
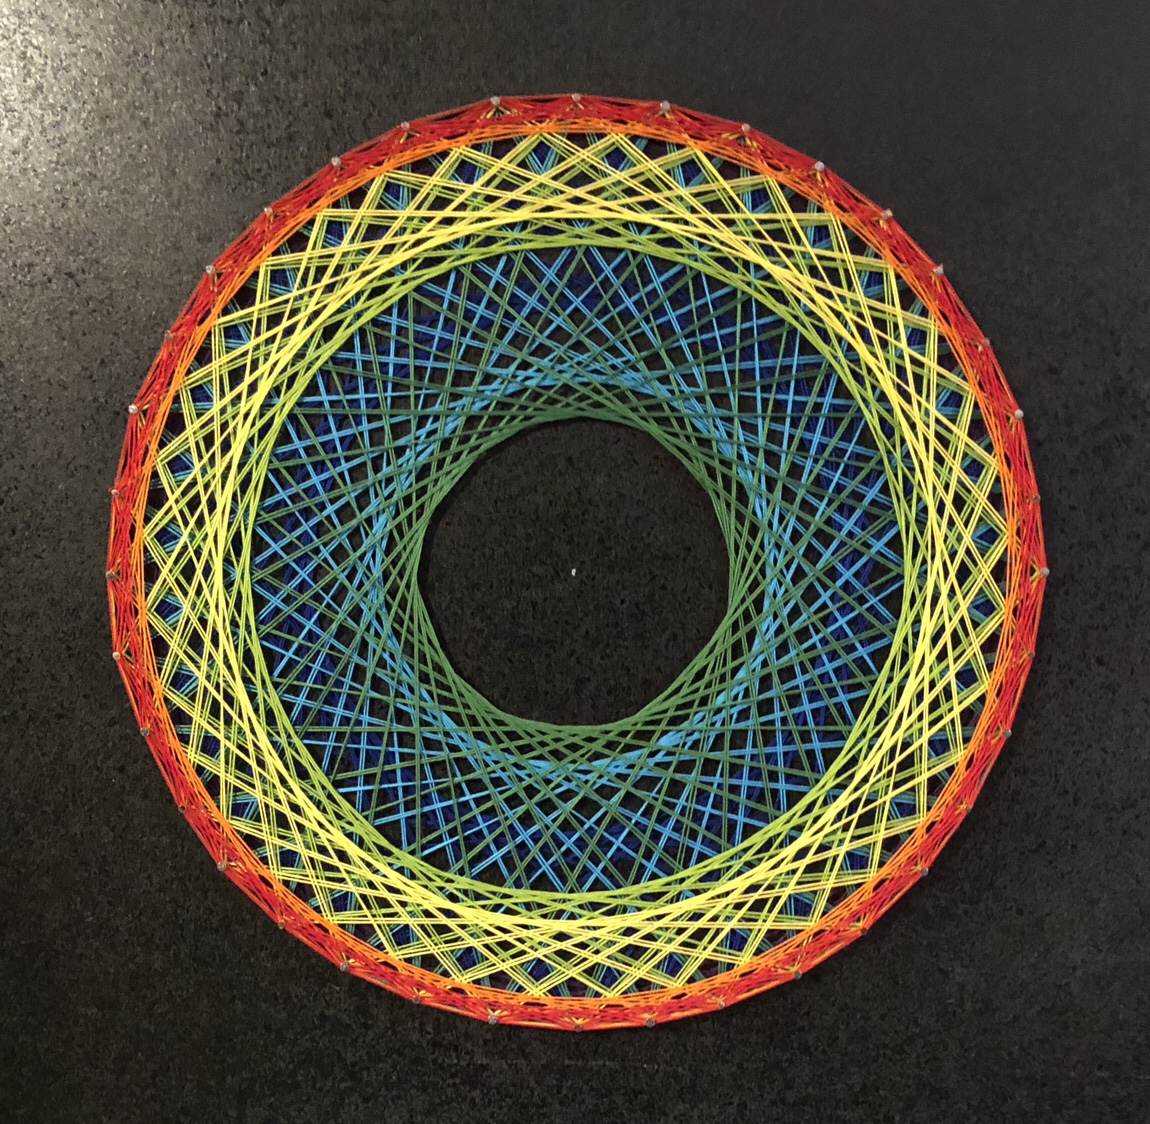
This next picture illustrates the rainbow color of the cross section which is formed.
Not wanting to stop there, I chose to apply the sequence to music.
The problem then becomes how to project a musical scale onto a 36-degree circle? It just so happens that 36 can be divided into 12 sets of 3 numbers. The Western musical scale also has 12 note values in an octave for the Chromatic Scale.
This process, unlike the previous two of mapping numbers and colors, cannot be reversed, though. Since numbers 1, 2, and 3, could all become the first note, there is no way to know the first note and from that extrapolate backwards whether that note is exactly 1, 2, or 3. But it is still a fun exercise to see how the Pi Sequence sounds when plotted onto the circle of notes.
For my version, I chose to start with the note A and build from A being the root note.
Note Note Value Original Number
A 0 1-3
A#/Bb 1 4-6
B 2 7-9
C 3 10-12
C#/Db 4 13-15
D 5 16-18
D#/Eb 6 19-21
E 7 22-24
F 8 25-27
F#/Gb 9 28-30
G 10 31-33
G#/Ab 11 34-36
A (again 1 octave higher)
Our Pi Sequence (3, 4, 8, 9, 14, 23, 25, 31, 36) becomes:
A, A#, B, B, C#, E, F, G, G#
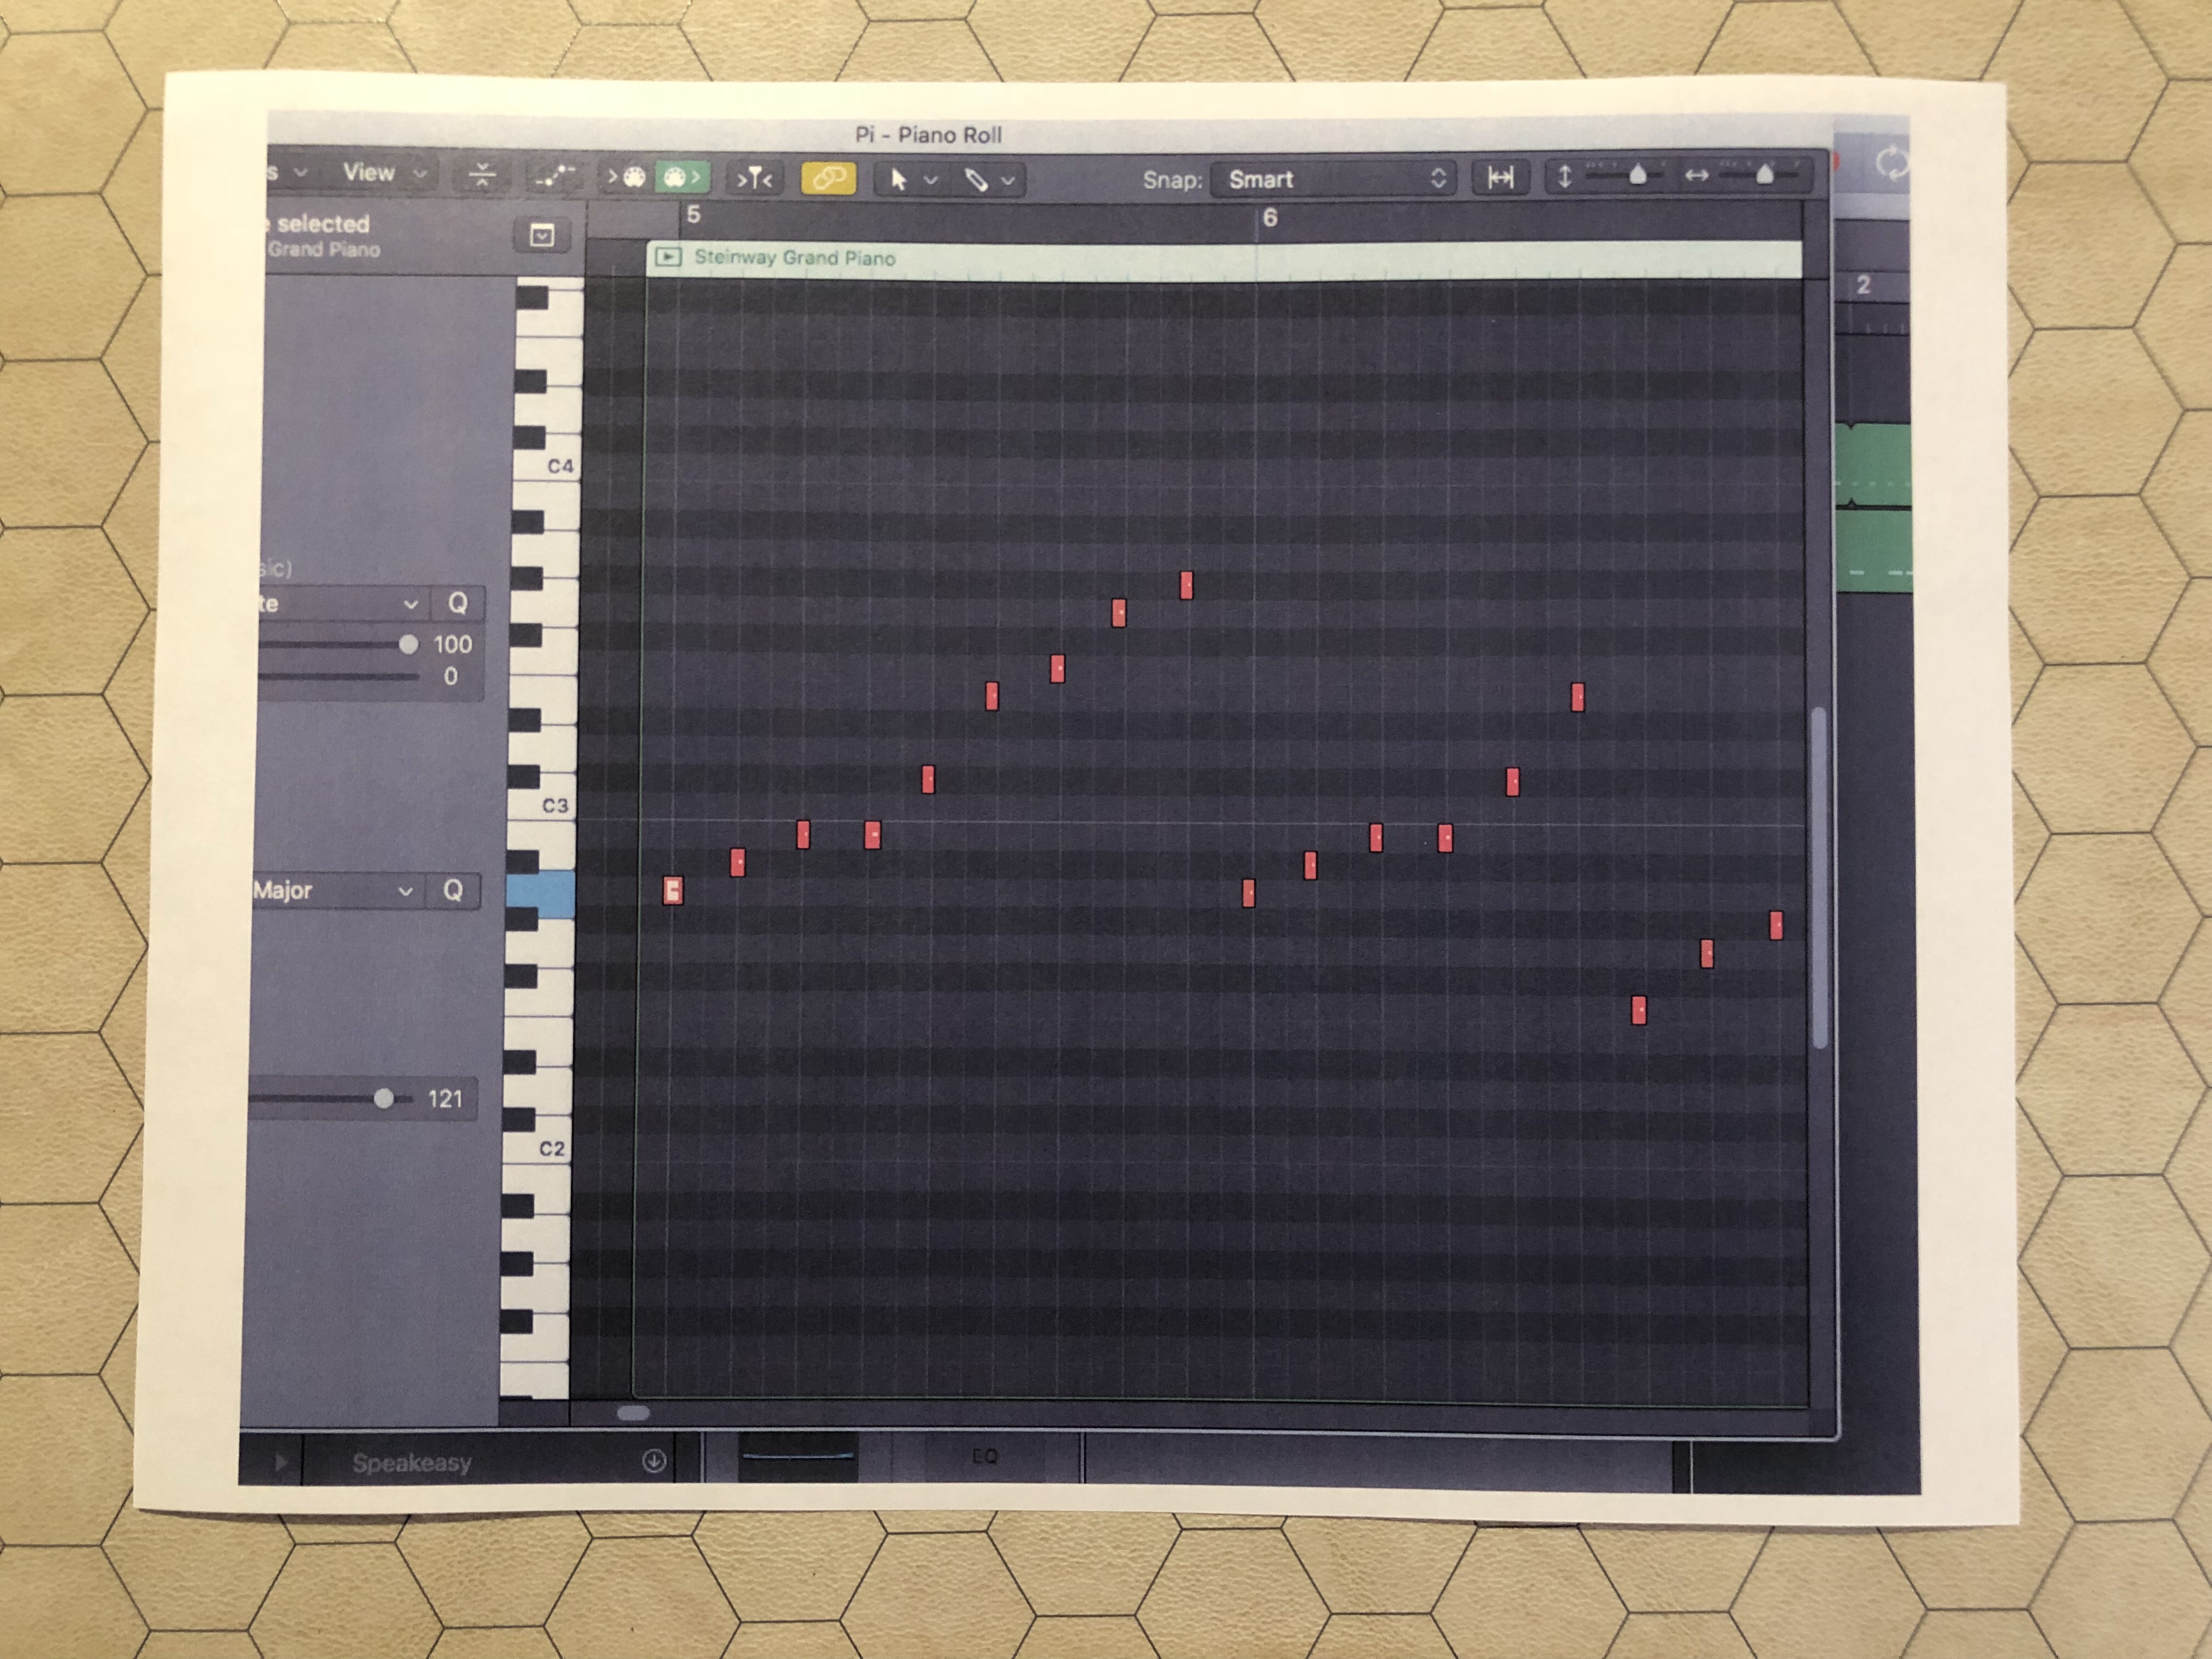
This creates 9 notes and I chose to write in the unorthodox time signature of 9/8 time. My method was to break down the notes into three groups of three notes each. I also wrote a return to Pi at the end that emphasized the numbers 3, 1, 4, 1, 5, and then 9 but using the 9-note sequence as a reprise. 314159 then plays over and over until fade out.
Plotted on a midi sequencer, it looks like this when played twice. I lowered the last 3 notes an octave.
Here is the final result.
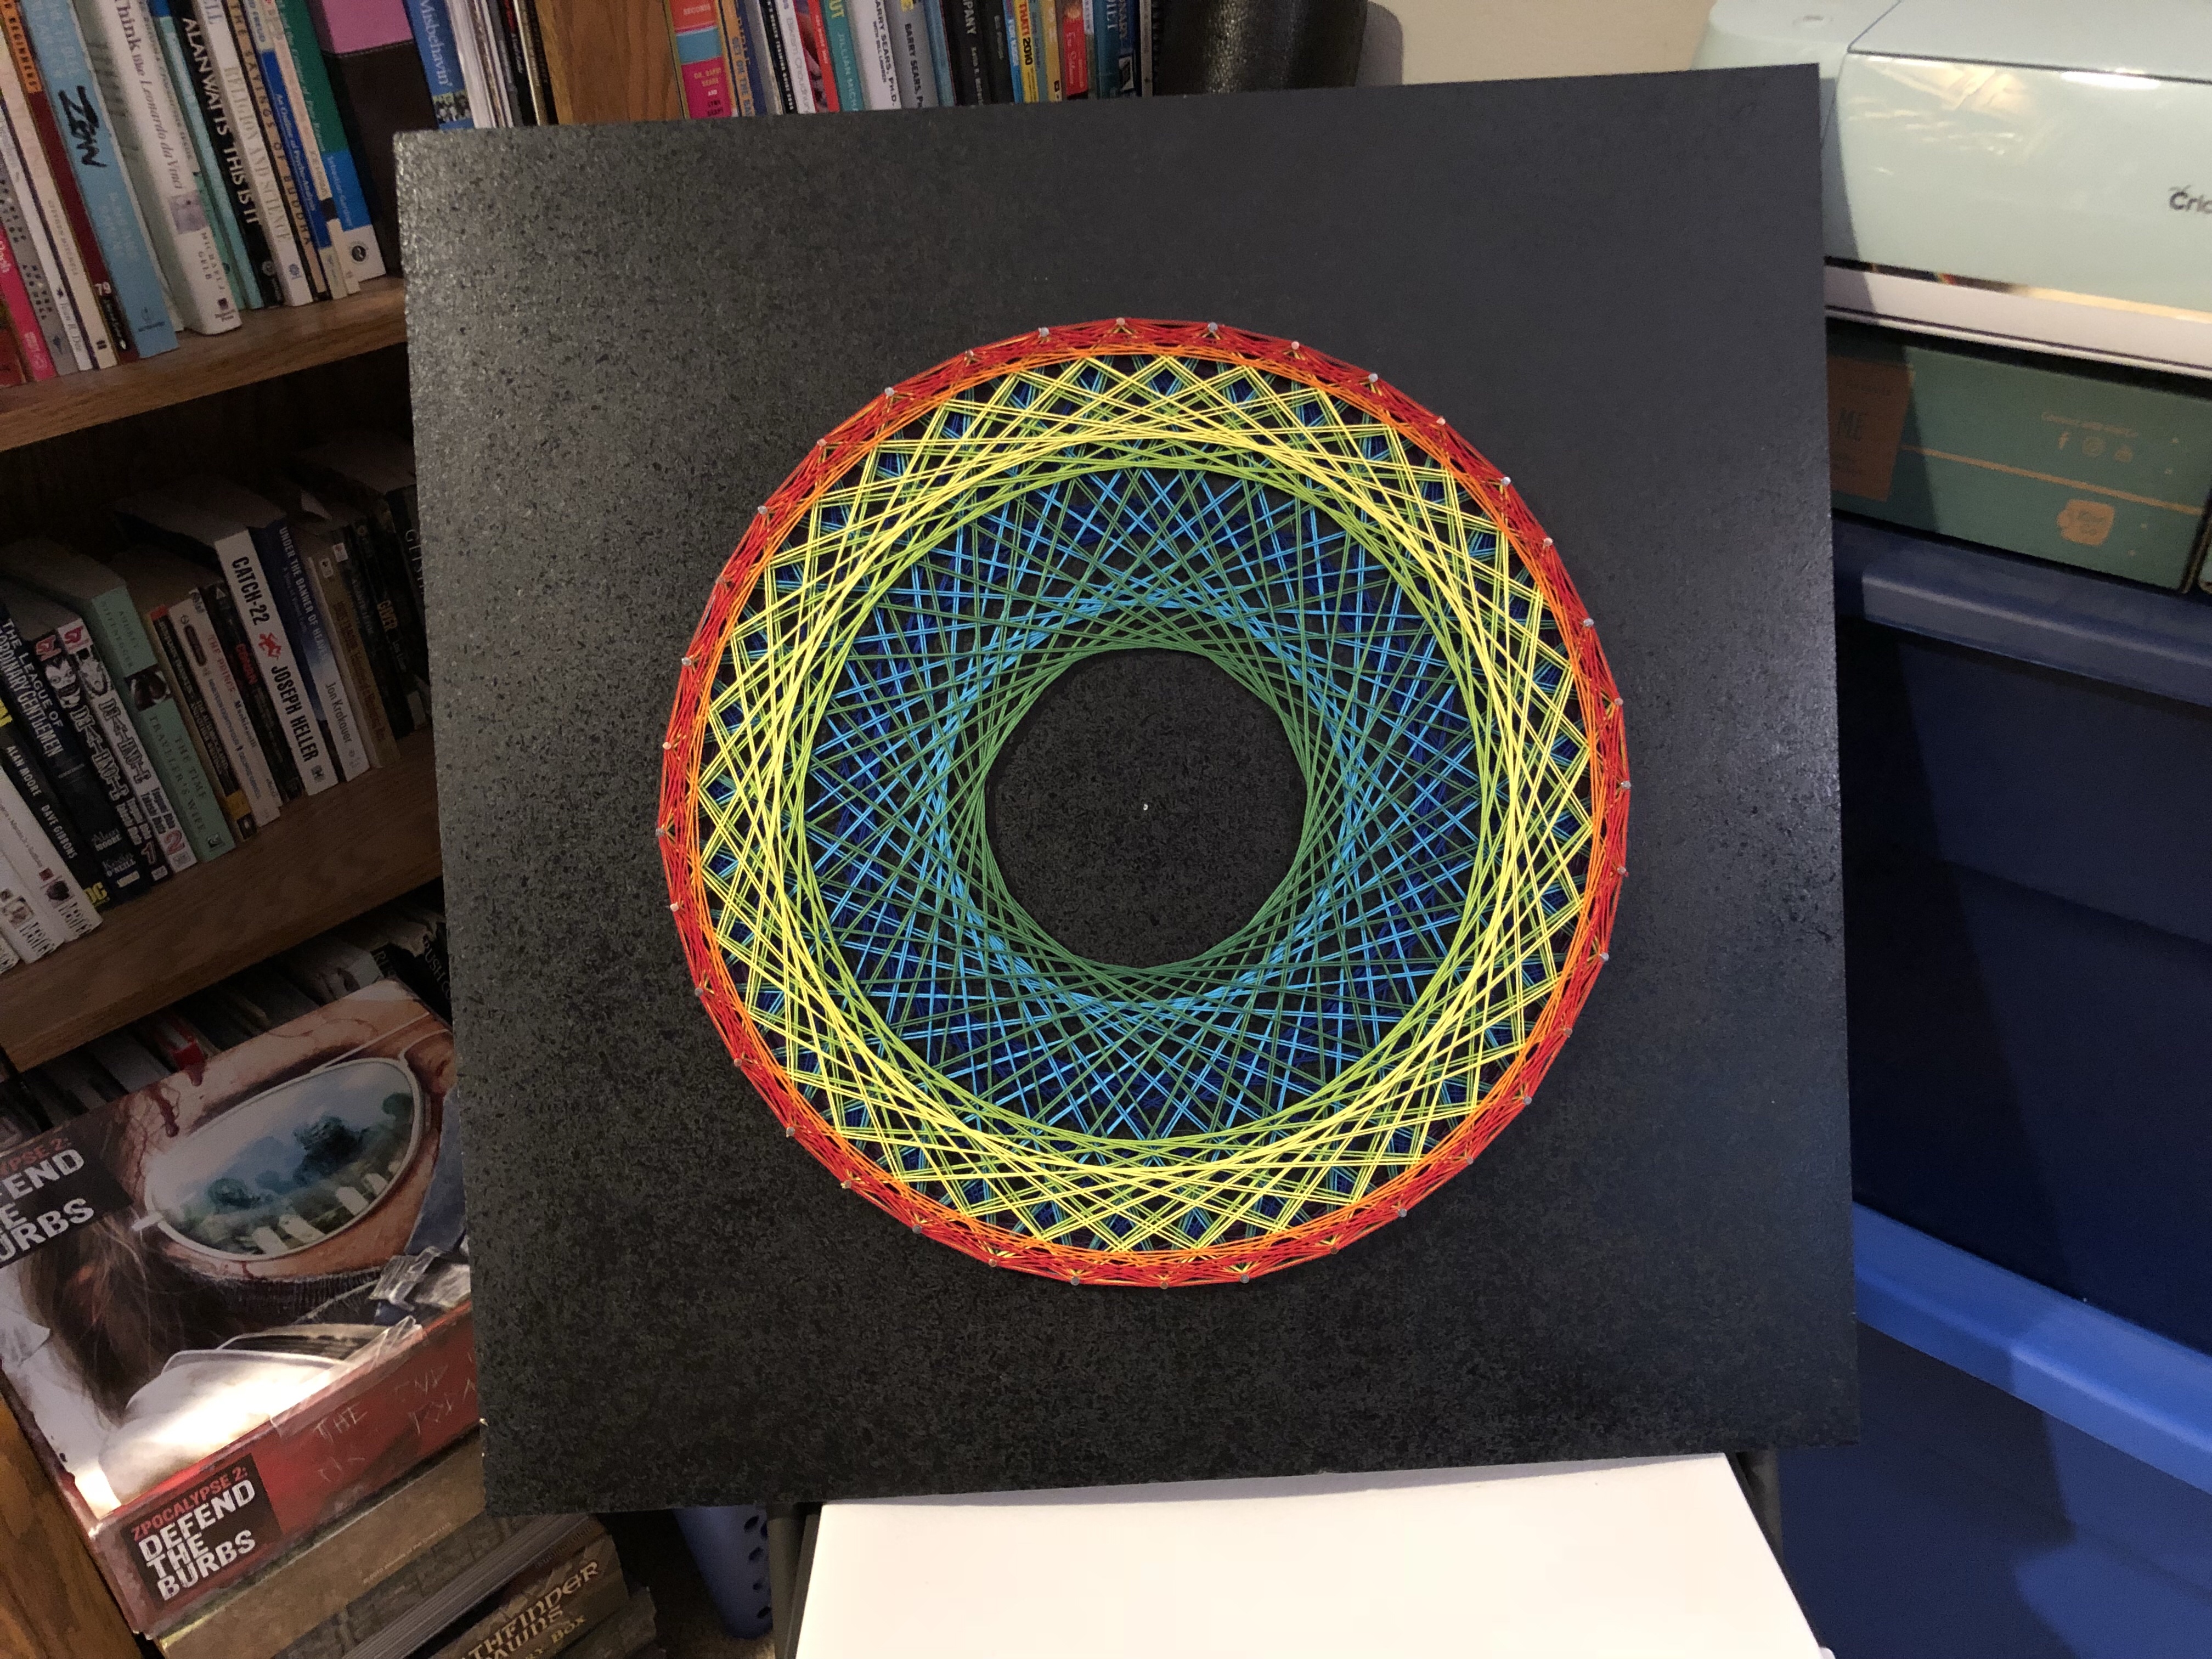
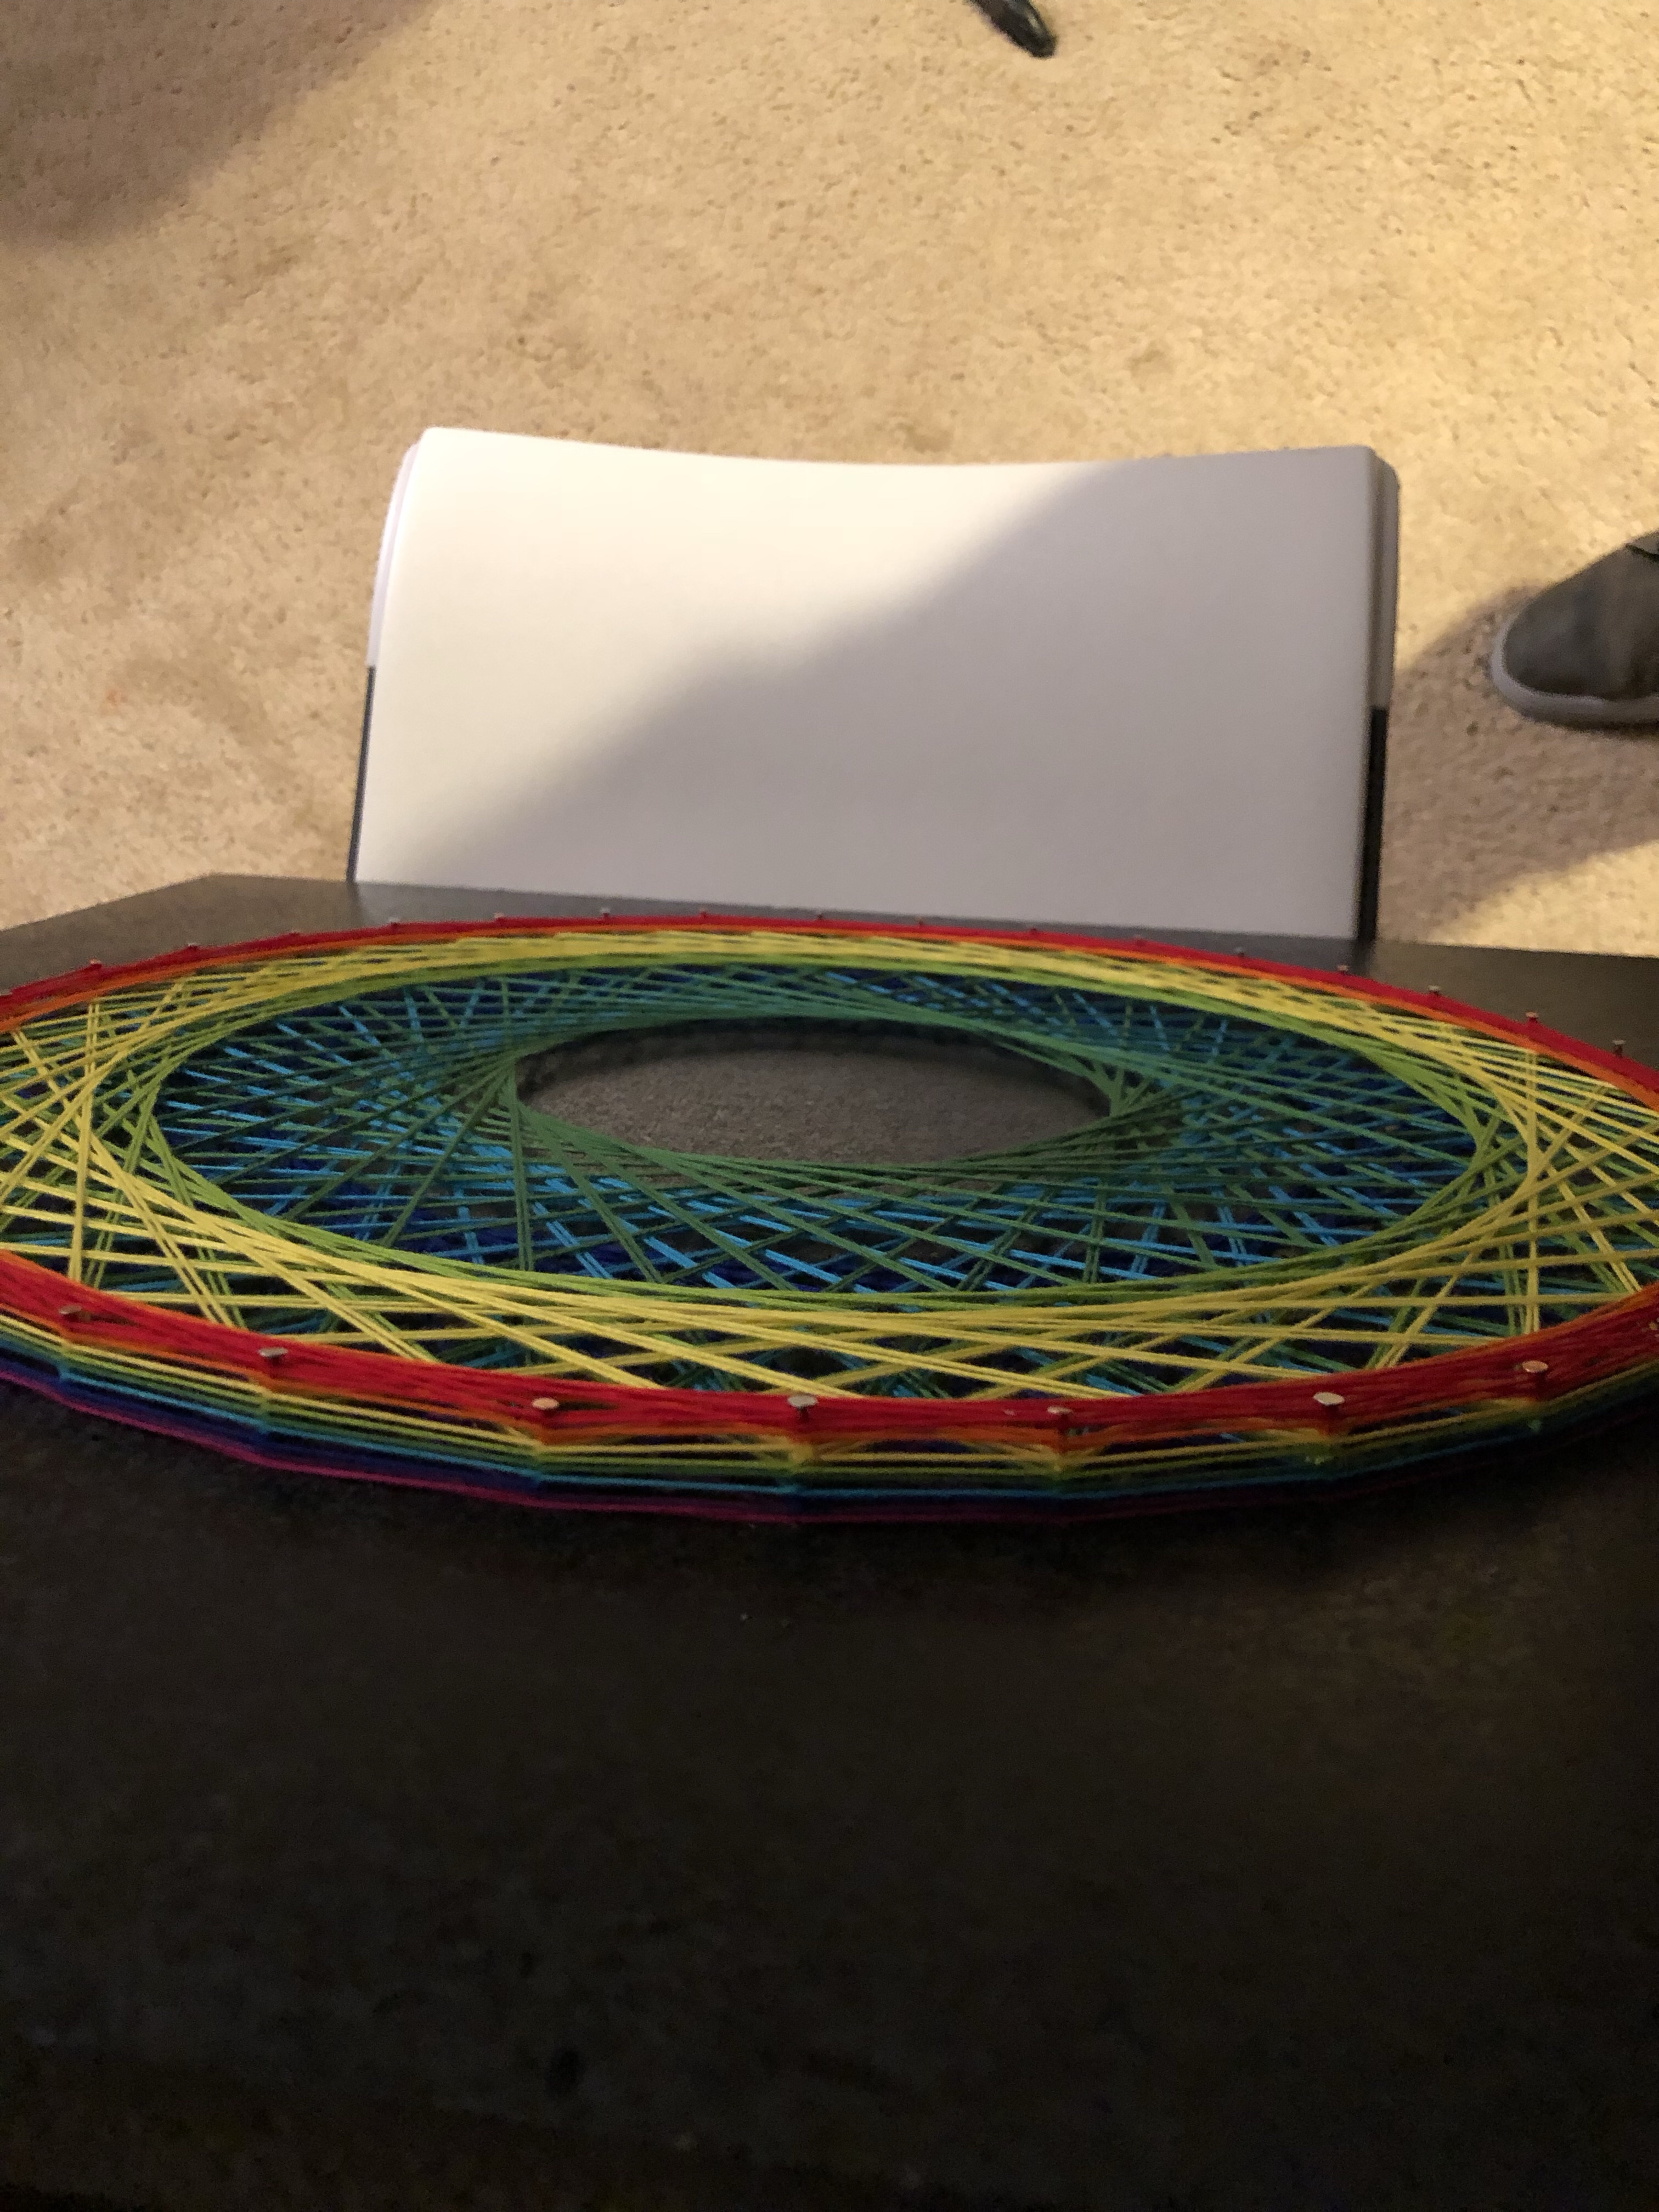
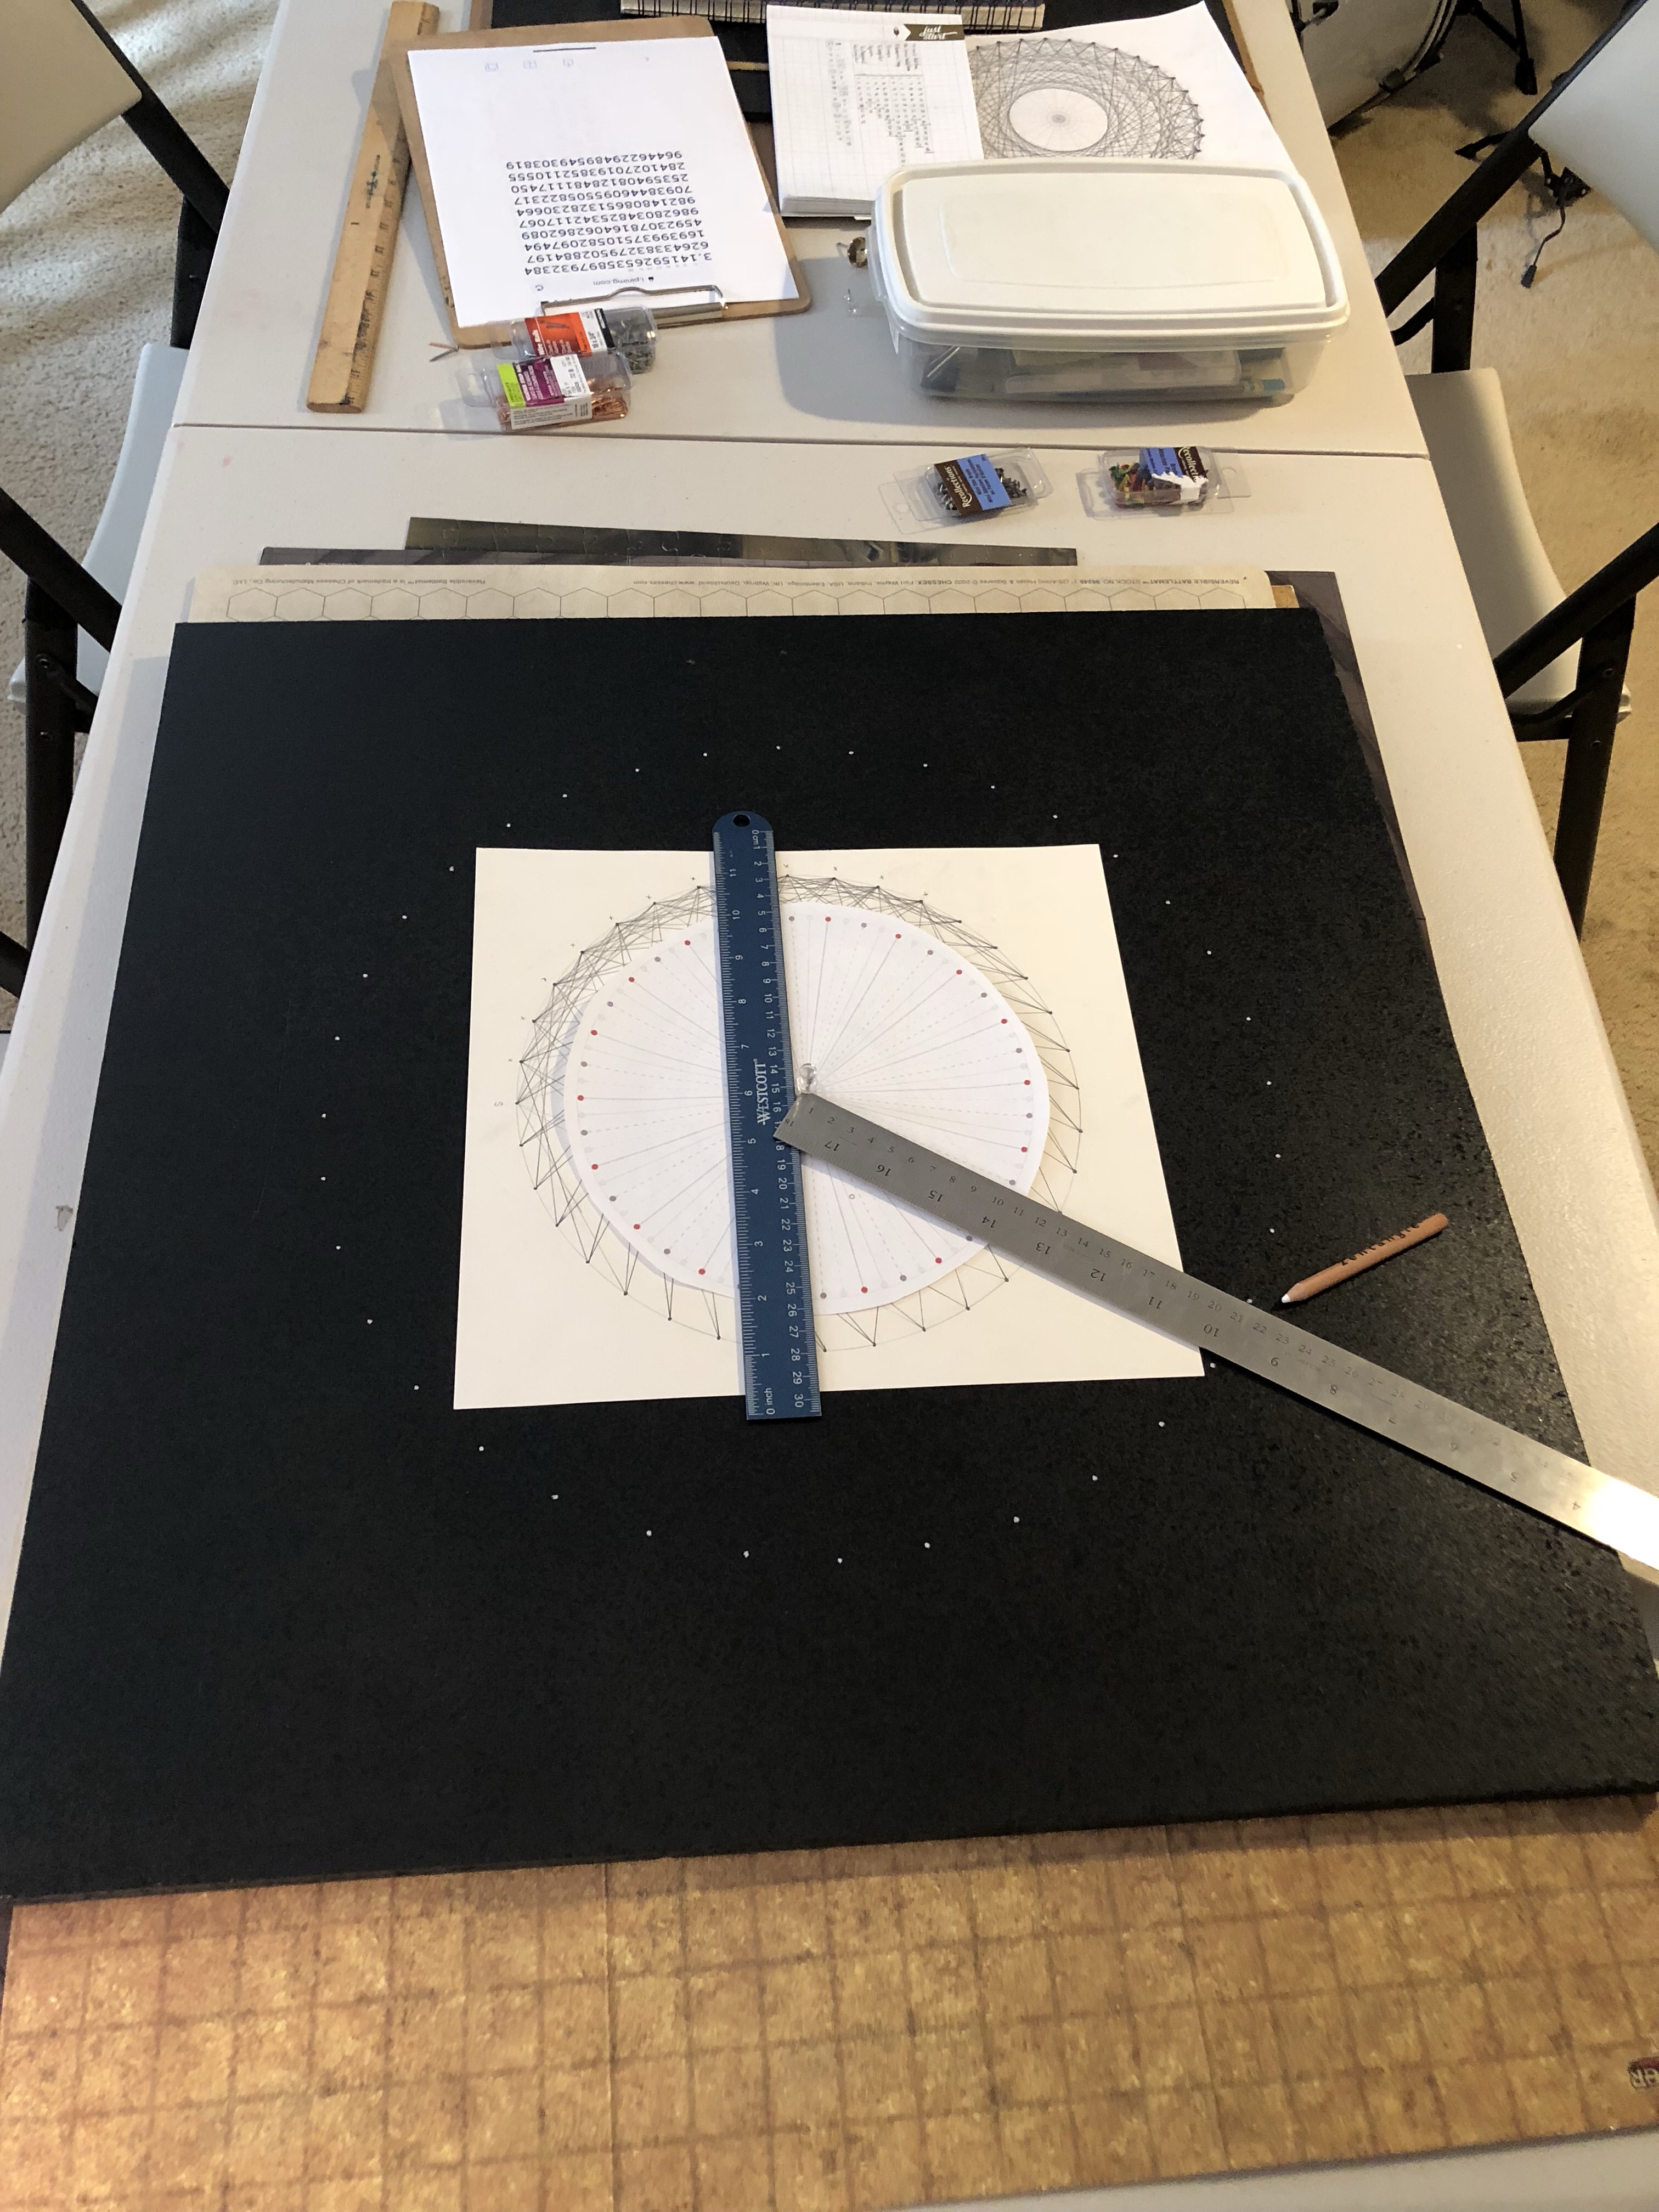
Here are several pictures of the build.

One Comment
I wish my teachers had introduced me to pi like this !